a growing experience - Student Services - University of Melbourne
a growing experience - Student Services - University of Melbourne
a growing experience - Student Services - University of Melbourne

You also want an ePaper? Increase the reach of your titles
YUMPU automatically turns print PDFs into web optimized ePapers that Google loves.
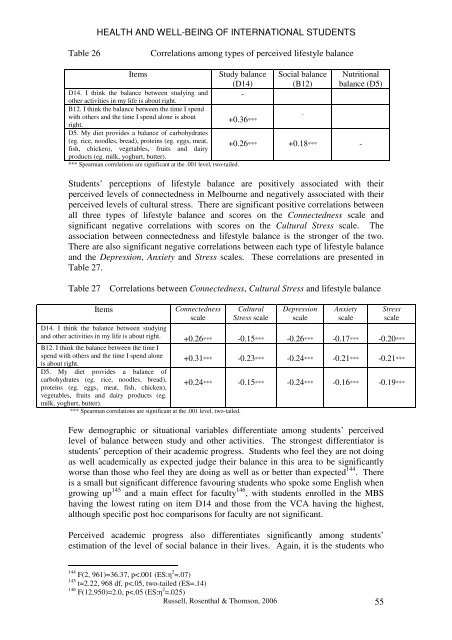
HEALTH AND WELL-BEING OF INTERNATIONAL STUDENTSTable 26Correlations among types <strong>of</strong> perceived lifestyle balanceItemsD14. I think the balance between studying andother activities in my life is about right.B12. I think the balance between the time I spendwith others and the time I spend alone is aboutright.D5. My diet provides a balance <strong>of</strong> carbohydrates(eg. rice, noodles, bread), proteins (eg. eggs, meat,fish, chicken), vegetables, fruits and dairyproducts (eg. milk, yoghurt, butter).*** Spearman correlations are significant at the .001 level, two-tailed.Study balance(D14)-+0.36***Social balance(B12)-Nutritionalbalance (D5)+0.26*** +0.18*** -<strong>Student</strong>s’ perceptions <strong>of</strong> lifestyle balance are positively associated with theirperceived levels <strong>of</strong> connectedness in <strong>Melbourne</strong> and negatively associated with theirperceived levels <strong>of</strong> cultural stress. There are significant positive correlations betweenall three types <strong>of</strong> lifestyle balance and scores on the Connectedness scale andsignificant negative correlations with scores on the Cultural Stress scale. Theassociation between connectedness and lifestyle balance is the stronger <strong>of</strong> the two.There are also significant negative correlations between each type <strong>of</strong> lifestyle balanceand the Depression, Anxiety and Stress scales. These correlations are presented inTable 27.Table 27Correlations between Connectedness, Cultural Stress and lifestyle balanceItemsConnectednessscaleCulturalStress scaleDepressionscaleAnxietyscaleD14. I think the balance between studyingand other activities in my life is about right.+0.26*** -0.15*** -0.26*** -0.17*** -0.20***B12. I think the balance between the time Ispend with others and the time I spend aloneis about right.D5. My diet provides a balance <strong>of</strong>carbohydrates (eg. rice, noodles, bread),proteins (eg. eggs, meat, fish, chicken),vegetables, fruits and dairy products (eg.milk, yoghurt, butter).*** Spearman correlations are significant at the .001 level, two-tailed.Stressscale+0.31*** -0.23*** -0.24*** -0.21*** -0.21***+0.24*** -0.15*** -0.24*** -0.16*** -0.19***Few demographic or situational variables differentiate among students’ perceivedlevel <strong>of</strong> balance between study and other activities. The strongest differentiator isstudents’ perception <strong>of</strong> their academic progress. <strong>Student</strong>s who feel they are not doingas well academically as expected judge their balance in this area to be significantlyworse than those who feel they are doing as well as or better than expected 144 . Thereis a small but significant difference favouring students who spoke some English when<strong>growing</strong> up 145 and a main effect for faculty 146 , with students enrolled in the MBShaving the lowest rating on item D14 and those from the VCA having the highest,although specific post hoc comparisons for faculty are not significant.Perceived academic progress also differentiates significantly among students’estimation <strong>of</strong> the level <strong>of</strong> social balance in their lives. Again, it is the students who144 F(2, 961)=36.37, p