

Estimating the Water Requirements for Plants of Floodplain Wetlands
Estimating the Water Requirements for Plants of Floodplain Wetlands
Estimating the Water Requirements for Plants of Floodplain Wetlands

Create successful ePaper yourself
Turn your PDF publications into a flip-book with our unique Google optimized e-Paper software.
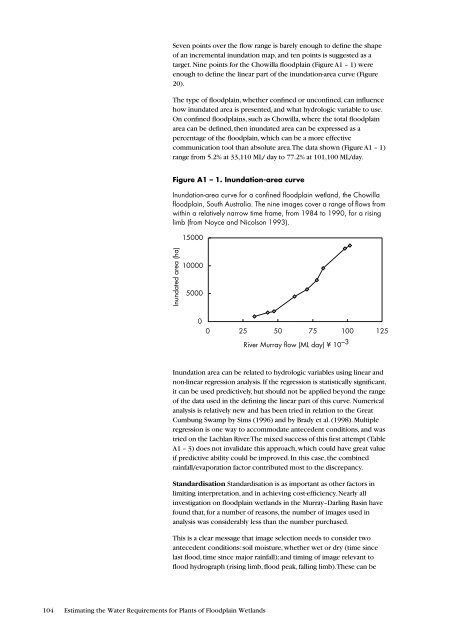
Seven points over <strong>the</strong> flow range is barely enough to define <strong>the</strong> shape<strong>of</strong> an incremental inundation map, and ten points is suggested as atarget. Nine points <strong>for</strong> <strong>the</strong> Chowilla floodplain (Figure A1 – 1) wereenough to define <strong>the</strong> linear part <strong>of</strong> <strong>the</strong> inundation-area curve (Figure20).The type <strong>of</strong> floodplain, whe<strong>the</strong>r confined or unconfined, can influencehow inundated area is presented, and what hydrologic variable to use.On confined floodplains, such as Chowilla, where <strong>the</strong> total floodplainarea can be defined, <strong>the</strong>n inundated area can be expressed as apercentage <strong>of</strong> <strong>the</strong> floodplain, which can be a more effectivecommunication tool than absolute area. The data shown (Figure A1 – 1)range from 5.2% at 33,110 ML/ day to 77.2% at 101,100 ML/day.Figure A1 – 1. Inundation-area curveInundation-area curve <strong>for</strong> a confined floodplain wetland, <strong>the</strong> Chowillafloodplain, South Australia. The nine images cover a range <strong>of</strong> flows fromwithin a relatively narrow time frame, from 1984 to 1990, <strong>for</strong> a risinglimb (from Noyce and Nicolson 1993).15000Inundated area (ha)10000500000 25 50 75 100 125River Murray flow (ML day) ¥ 10 –3Inundation area can be related to hydrologic variables using linear andnon-linear regression analysis. If <strong>the</strong> regression is statistically significant,it can be used predictively, but should not be applied beyond <strong>the</strong> range<strong>of</strong> <strong>the</strong> data used in <strong>the</strong> defining <strong>the</strong> linear part <strong>of</strong> this curve. Numericalanalysis is relatively new and has been tried in relation to <strong>the</strong> GreatCumbung Swamp by Sims (1996) and by Brady et al. (1998). Multipleregression is one way to accommodate antecedent conditions, and wastried on <strong>the</strong> Lachlan River. The mixed success <strong>of</strong> this first attempt (TableA1 – 3) does not invalidate this approach, which could have great valueif predictive ability could be improved. In this case, <strong>the</strong> combinedrainfall/evaporation factor contributed most to <strong>the</strong> discrepancy.Standardisation Standardisation is as important as o<strong>the</strong>r factors inlimiting interpretation, and in achieving cost-efficiency. Nearly allinvestigation on floodplain wetlands in <strong>the</strong> Murray–Darling Basin havefound that, <strong>for</strong> a number <strong>of</strong> reasons, <strong>the</strong> number <strong>of</strong> images used inanalysis was considerably less than <strong>the</strong> number purchased.This is a clear message that image selection needs to consider twoantecedent conditions: soil moisture, whe<strong>the</strong>r wet or dry (time sincelast flood, time since major rainfall); and timing <strong>of</strong> image relevant t<strong>of</strong>lood hydrograph (rising limb, flood peak, falling limb). These can be104 <strong>Estimating</strong> <strong>the</strong> <strong>Water</strong> <strong>Requirements</strong> <strong>for</strong> <strong>Plants</strong> <strong>of</strong> <strong>Floodplain</strong> <strong>Wetlands</strong>


