Focusing on depth<strong>Water</strong> regime analysis needs to consider all components <strong>of</strong> plant waterregime. A limitation <strong>of</strong> most field investigations is <strong>the</strong>ir emphasis on justone, sometimes two, components, with <strong>the</strong> assumption that o<strong>the</strong>rcomponents have not changed. Flood frequency is <strong>of</strong>ten chosen,probably because it is easily quantified by inundation mapping andhydrologic modelling, but it is only one <strong>of</strong> seven components.With floodplain wetlands, <strong>the</strong> sheer size and diversity <strong>of</strong> <strong>the</strong> floodplainarea presents particular challenges. Unlike small, isolated waterbodieswhere frequency, magnitude and duration <strong>of</strong> flooding are relativelyuni<strong>for</strong>m or tightly correlated, water regime is not uni<strong>for</strong>m across <strong>the</strong>floodplain; thus, statistics based on spatial averages may not bemeaningful. Ideally, flood frequency and duration, and o<strong>the</strong>rcomponents <strong>of</strong> plant water regime, should be estimated <strong>for</strong>hydrologically homogeneous sub-units <strong>of</strong> <strong>the</strong> floodplain wetland.However, this could result in working with numerous, very smallmanagement sub-units, making modelling an impossibility. Typically,<strong>the</strong>se sub-units are aggregated and larger spatial units such as plantcommunities are considered.An alternative is to reinterpret plant water regime as spatial andtemporal variations <strong>of</strong> just one component — depth — by workingwith three states:• inundated and submerged;• inundated, but not submerged; and• not inundated.In this way, plant water regime can be modelled as a time series <strong>of</strong> <strong>the</strong>sethree states. For each state, key statistics are <strong>the</strong> mean duration and <strong>the</strong>variability <strong>of</strong> <strong>the</strong> duration. O<strong>the</strong>r useful statistics are <strong>the</strong> mean andvariability <strong>of</strong> <strong>the</strong> period between <strong>the</strong> occurrence <strong>of</strong> a given state, and<strong>the</strong> seasonal occurrence <strong>of</strong> <strong>the</strong> three different states.Focusing on depth represents an ideal, targeted at developing models.Even if modelling is not <strong>the</strong> aim, focusing on depth is one way toreduce complexity and make it easier to work with water regime.32 <strong>Estimating</strong> <strong>the</strong> <strong>Water</strong> <strong>Requirements</strong> <strong>for</strong> <strong>Plants</strong> <strong>of</strong> <strong>Floodplain</strong> <strong>Wetlands</strong>
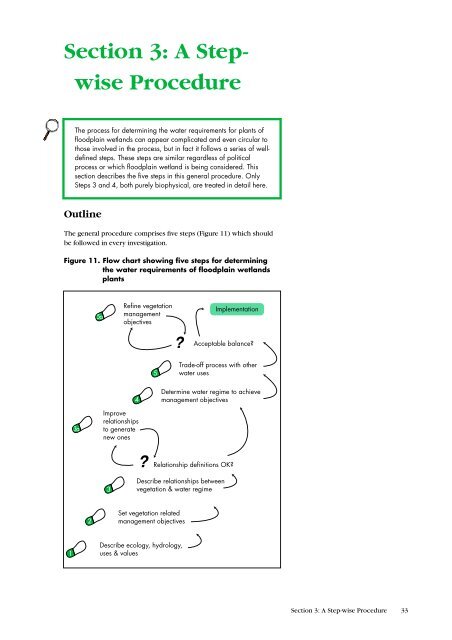
Section 3: A StepwiseProcedureThe process <strong>for</strong> determining <strong>the</strong> water requirements <strong>for</strong> plants <strong>of</strong>floodplain wetlands can appear complicated and even circular tothose involved in <strong>the</strong> process, but in fact it follows a series <strong>of</strong> welldefinedsteps. These steps are similar regardless <strong>of</strong> politicalprocess or which floodplain wetland is being considered. Thissection describes <strong>the</strong> five steps in this general procedure. OnlySteps 3 and 4, both purely biophysical, are treated in detail here.OutlineThe general procedure comprises five steps (Figure 11) which shouldbe followed in every investigation.Figure 11. Flow chart showing five steps <strong>for</strong> determining<strong>the</strong> water requirements <strong>of</strong> floodplain wetlandsplants5aRefine vegetationmanagementobjectives?ImplementationAcceptable balance?5Trade-<strong>of</strong>f process with o<strong>the</strong>rwater uses4Determine water regime to achievemanagement objectives3aImproverelationshipsto generatenew ones?Relationship definitions OK?3Describe relationships betweenvegetation & water regime2Set vegetation relatedmanagement objectives1Describe ecology, hydrology,uses & valuesSection 3: A Step-wise Procedure 33
- Page 1 and 2: Estimating the WaterRequirements fo
- Page 3 and 4: ContentsPreface 7Acknowledgments 8G
- Page 5: List of Tables1 Spatial variability
- Page 8 and 9: Note that the guide is concerned pr
- Page 10 and 11: ecomes a matter of how to use what
- Page 12 and 13: Figure 1. Floodplain featuresThe fl
- Page 14 and 15: Figure 4.Wanganella Swamps, souther
- Page 16 and 17: Floodplain wetlands, being a mosaic
- Page 18 and 19: Section 2:Introducing theVegetation
- Page 20 and 21: size and vigour rarely reach their
- Page 22 and 23: floodplains survive there because t
- Page 24 and 25: The lagoon floor is then colonised
- Page 26 and 27: Note 11Growth-formsField guides to
- Page 28 and 29: identical conditions. PFTs differ f
- Page 30 and 31: Note 13Changes in depthSome herbace
- Page 34 and 35: Note 15Internet dataEnvironmental d
- Page 36 and 37: Step 3: Vegetation-hydrologyrelatio
- Page 38 and 39: Note 19Modelling and time-stepsIn s
- Page 40 and 41: Section 4: Old andNew DataOne of th
- Page 42 and 43: see Figure 15), despite a three-fol
- Page 44 and 45: frequency. This is rather limiting,
- Page 46 and 47: Figure 13. Lippia, a floodplain wee
- Page 48 and 49: single measure of the vegetation to
- Page 50 and 51: Section 5:ObtainingVegetation DataW
- Page 52 and 53: However, if the chosen species has
- Page 54 and 55: Figure 15. Range of tree condition
- Page 56 and 57: Figure 16. Spatial-temporal sequenc
- Page 58 and 59: Note 26Canopy condition indexA visu
- Page 60 and 61: Note 27Mapping floodplainwetland ve
- Page 62 and 63: Shape of species responseThe shape
- Page 64 and 65: Figure 18. Heat pulse sensorHeat pu
- Page 66 and 67: section, using storage volume and i
- Page 68 and 69: Figure 20. Crack volume and drying
- Page 70 and 71: Figure 21. The relationshipbetween
- Page 72 and 73: epresentative, there should be no m
- Page 74 and 75: All of the curves are described by
- Page 76 and 77: monitoring, precision levels, scali
- Page 78 and 79: sites of significant recharge and d
- Page 80 and 81: Figure 24. Degraded channelPart of
- Page 82 and 83:
and so depth estimates are inaccura
- Page 84 and 85:
Section 7:PredictingVegetationRespo
- Page 86 and 87:
AEAM and the Macquarie Marshes. An
- Page 88 and 89:
Category 3: hydraulic/empiricalAppr
- Page 90 and 91:
For example, changes in surface and
- Page 92 and 93:
ReferencesPrefaceArthington AH and
- Page 94 and 95:
Section 3Roberts J and Marston F (1
- Page 96 and 97:
Kunin WE and Gaston KG (1993). The
- Page 98 and 99:
Singh VP (1995).“Computer models
- Page 100 and 101:
Web ListingsNote 40Data on the WebM
- Page 102 and 103:
flood. This has not been attempted,
- Page 104 and 105:
Seven points over the flow range is
- Page 106 and 107:
used as exclusions; or can be quant
- Page 108 and 109:
Table A1 - 4. A flooding overlay ch
- Page 110:
Table A2 - 1.(cont’d) K c and K s