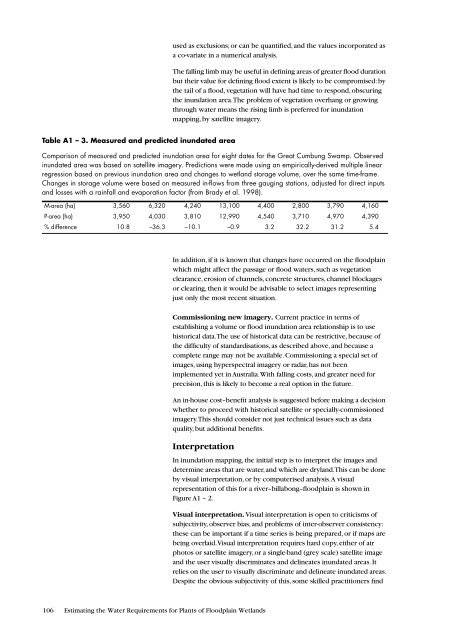
used as exclusions; or can be quantified, and <strong>the</strong> values incorporated asa co-variate in a numerical analysis.The falling limb may be useful in defining areas <strong>of</strong> greater flood durationbut <strong>the</strong>ir value <strong>for</strong> defining flood extent is likely to be compromised: by<strong>the</strong> tail <strong>of</strong> a flood, vegetation will have had time to respond, obscuring<strong>the</strong> inundation area. The problem <strong>of</strong> vegetation overhang or growingthrough water means <strong>the</strong> rising limb is preferred <strong>for</strong> inundationmapping, by satellite imagery.Table A1 – 3. Measured and predicted inundated areaComparison <strong>of</strong> measured and predicted inundation area <strong>for</strong> eight dates <strong>for</strong> <strong>the</strong> Great Cumbung Swamp. Observedinundated area was based on satellite imagery. Predictions were made using an empirically-derived multiple linearregression based on previous inundation area and changes to wetland storage volume, over <strong>the</strong> same time-frame.Changes in storage volume were based on measured in-flows from three gauging stations, adjusted <strong>for</strong> direct inputsand losses with a rainfall and evaporation factor (from Brady et al. 1998).M-area (ha) 3,560 6,320 4,240 13,100 4,400 2,800 3,790 4,160P-area (ha) 3,950 4,030 3,810 12,990 4,540 3,710 4,970 4,390% difference 10.8 –36.3 –10.1 –0.9 3.2 32.2 31.2 5.4In addition, if it is known that changes have occurred on <strong>the</strong> floodplainwhich might affect <strong>the</strong> passage or flood waters, such as vegetationclearance, erosion <strong>of</strong> channels, concrete structures, channel blockagesor clearing, <strong>the</strong>n it would be advisable to select images representingjust only <strong>the</strong> most recent situation.Commissioning new imagery. Current practice in terms <strong>of</strong>establishing a volume or flood inundation area relationship is to usehistorical data. The use <strong>of</strong> historical data can be restrictive, because <strong>of</strong><strong>the</strong> difficulty <strong>of</strong> standardisations, as described above, and because acomplete range may not be available. Commissioning a special set <strong>of</strong>images, using hyperspectral imagery or radar, has not beenimplemented yet in Australia. With falling costs, and greater need <strong>for</strong>precision, this is likely to become a real option in <strong>the</strong> future.An in-house cost–benefit analysis is suggested be<strong>for</strong>e making a decisionwhe<strong>the</strong>r to proceed with historical satellite or specially-commissionedimagery. This should consider not just technical issues such as dataquality, but additional benefits.InterpretationIn inundation mapping, <strong>the</strong> initial step is to interpret <strong>the</strong> images anddetermine areas that are water, and which are dryland. This can be doneby visual interpretation, or by computerised analysis. A visualrepresentation <strong>of</strong> this <strong>for</strong> a river–billabong–floodplain is shown inFigure A1 – 2.Visual interpretation. Visual interpretation is open to criticisms <strong>of</strong>subjectivity, observer bias, and problems <strong>of</strong> inter-observer consistency:<strong>the</strong>se can be important if a time series is being prepared, or if maps arebeing overlaid. Visual interpretation requires hard copy, ei<strong>the</strong>r <strong>of</strong> airphotos or satellite imagery, or a single-band (grey scale) satellite imageand <strong>the</strong> user visually discriminates and delineates inundated areas. Itrelies on <strong>the</strong> user to visually discriminate and delineate inundated areas.Despite <strong>the</strong> obvious subjectivity <strong>of</strong> this, some skilled practitioners find106 <strong>Estimating</strong> <strong>the</strong> <strong>Water</strong> <strong>Requirements</strong> <strong>for</strong> <strong>Plants</strong> <strong>of</strong> <strong>Floodplain</strong> <strong>Wetlands</strong>
visual interpretation <strong>of</strong> satellite images to be more effective than relyingon computerised analysis. The human eye can successfully integrate andinterpret complicated in<strong>for</strong>mation such as flow lines in shallow waterover submerged vegetation, and can account <strong>for</strong> and understandchanges in water quality across a flood front.The main difficulties are in defining boundaries when water is overhungwith vegetation, and in comparing RGB combinations with grey-scaleimagery.Computerised analysis. Computerised analytical techniques <strong>for</strong>processing satellite imagery are histogram slicing, band ratios orclassification.Histogram slicing uses single band grey-scale digital data images, andclusters pixels according to <strong>the</strong>ir brightness. Its advantages are only thatvery little data processing is required. Its disadvantages includesubjectivity in slicing images, difficulties in maintaining consistencybetween images, and potential to underestimate water area if obscuredby overhanging leaf canopy. Band ratios improve <strong>the</strong> detection <strong>of</strong> waterpixels.Classification refers to a range <strong>of</strong> numerical techniques, generally <strong>the</strong>seare based on two or more bands <strong>of</strong> digital data, ie. cannot be done on ahard copy. Classification, if properly done, requires field back-up orreference areas to ‘train’ <strong>the</strong> image which can also be limiting andrequires a degree <strong>of</strong> familiarity with remote sensing data or packages.Checking interpretationIn inundation mapping, where water boundaries can be hard to define(see above), a simple check on mapping can be implemented byoverlaying maps.Overlay checkThe assumption behind this procedure is that successively larger floodswill inundate <strong>the</strong> same area as a smaller flood plus some ‘new’ area.Overlays done with hard copy only (eg. on light table) give a qualitativeindication <strong>of</strong> error. Overlays done using a GIS indicate magnitude <strong>of</strong>error.Sources <strong>of</strong> discrepancy between successive flood maps are: errors inestimating hydrologic variables (storage volume, wetland inflow); errorsin estimating inundation area, such as ambiguous data, subjectiveinterpretation, poor quality imagery, incorrect rectification; naturalchanges to flood patterns, such as fallen trees, minor channel avulsions;anthropogenic changes on <strong>the</strong> floodplain, such as flowpath aggradationor degradation; flowpaths completely or partly obstructed, <strong>for</strong> exampleby structures such as levees or bridges, or simply fences or fallen trees;and vegetation clearance affecting roughness and water distribution.A process <strong>of</strong> elimination is needed to determine which <strong>of</strong> <strong>the</strong>se are <strong>the</strong>sources, in particular which are operator and technical errors, andwhich are site-specific factors.Overlaying can also be used to compare different methods (Table A1 –5). Agreement within 5% looks robust but larger discrepancies meritattention.Appendix 1: Remote Sensing 107
- Page 1 and 2:
Estimating the WaterRequirements fo
- Page 3 and 4:
ContentsPreface 7Acknowledgments 8G
- Page 5:
List of Tables1 Spatial variability
- Page 8 and 9:
Note that the guide is concerned pr
- Page 10 and 11:
ecomes a matter of how to use what
- Page 12 and 13:
Figure 1. Floodplain featuresThe fl
- Page 14 and 15:
Figure 4.Wanganella Swamps, souther
- Page 16 and 17:
Floodplain wetlands, being a mosaic
- Page 18 and 19:
Section 2:Introducing theVegetation
- Page 20 and 21:
size and vigour rarely reach their
- Page 22 and 23:
floodplains survive there because t
- Page 24 and 25:
The lagoon floor is then colonised
- Page 26 and 27:
Note 11Growth-formsField guides to
- Page 28 and 29:
identical conditions. PFTs differ f
- Page 30 and 31:
Note 13Changes in depthSome herbace
- Page 32 and 33:
Focusing on depthWater regime analy
- Page 34 and 35:
Note 15Internet dataEnvironmental d
- Page 36 and 37:
Step 3: Vegetation-hydrologyrelatio
- Page 38 and 39:
Note 19Modelling and time-stepsIn s
- Page 40 and 41:
Section 4: Old andNew DataOne of th
- Page 42 and 43:
see Figure 15), despite a three-fol
- Page 44 and 45:
frequency. This is rather limiting,
- Page 46 and 47:
Figure 13. Lippia, a floodplain wee
- Page 48 and 49:
single measure of the vegetation to
- Page 50 and 51:
Section 5:ObtainingVegetation DataW
- Page 52 and 53:
However, if the chosen species has
- Page 54 and 55:
Figure 15. Range of tree condition
- Page 56 and 57: Figure 16. Spatial-temporal sequenc
- Page 58 and 59: Note 26Canopy condition indexA visu
- Page 60 and 61: Note 27Mapping floodplainwetland ve
- Page 62 and 63: Shape of species responseThe shape
- Page 64 and 65: Figure 18. Heat pulse sensorHeat pu
- Page 66 and 67: section, using storage volume and i
- Page 68 and 69: Figure 20. Crack volume and drying
- Page 70 and 71: Figure 21. The relationshipbetween
- Page 72 and 73: epresentative, there should be no m
- Page 74 and 75: All of the curves are described by
- Page 76 and 77: monitoring, precision levels, scali
- Page 78 and 79: sites of significant recharge and d
- Page 80 and 81: Figure 24. Degraded channelPart of
- Page 82 and 83: and so depth estimates are inaccura
- Page 84 and 85: Section 7:PredictingVegetationRespo
- Page 86 and 87: AEAM and the Macquarie Marshes. An
- Page 88 and 89: Category 3: hydraulic/empiricalAppr
- Page 90 and 91: For example, changes in surface and
- Page 92 and 93: ReferencesPrefaceArthington AH and
- Page 94 and 95: Section 3Roberts J and Marston F (1
- Page 96 and 97: Kunin WE and Gaston KG (1993). The
- Page 98 and 99: Singh VP (1995).“Computer models
- Page 100 and 101: Web ListingsNote 40Data on the WebM
- Page 102 and 103: flood. This has not been attempted,
- Page 104 and 105: Seven points over the flow range is
- Page 108 and 109: Table A1 - 4. A flooding overlay ch
- Page 110: Table A2 - 1.(cont’d) K c and K s