section, using storage volume and inundation area, including how touse topographic data to determine <strong>the</strong> spatial variations in depth.Techniques available <strong>for</strong> determining inundation areas are presented,followed by a description <strong>of</strong> <strong>the</strong> hydrological techniques <strong>for</strong>determining <strong>the</strong> different components <strong>of</strong> a water balance.Using storage volume and inundation areaAn average water depth (in metres) <strong>for</strong> a floodplain wetland can becalculated by dividing storage volume (in cubic metres) by inundatedarea (in square metres). For this, inundation area and storage volume <strong>for</strong>a large flood are needed.This average water depth ignores <strong>the</strong> proportion <strong>of</strong> <strong>the</strong> storage volumeheld in <strong>the</strong> soil. An improved estimate can be obtained by determining<strong>the</strong> soil storage volume. The spatial variability in water depth can beestimated using descriptions <strong>of</strong> <strong>the</strong> surface topography <strong>of</strong> <strong>the</strong>floodplain.Soil storage volumeStorage volume includes both surface water and water held in <strong>the</strong> soil,also known as <strong>the</strong> soil moisture store, and this can account <strong>for</strong> asignificant fraction <strong>of</strong> <strong>the</strong> total storage volume. Subtracting <strong>the</strong> soilmoisture store from <strong>the</strong> total storage volume will leave surface water,giving a more accurate estimate <strong>of</strong> average water depth.The soil moisture store, as a volume, is <strong>the</strong> depth <strong>of</strong> water thatinfiltrates <strong>the</strong> soil pr<strong>of</strong>ile, integrated across <strong>the</strong> inundated area.Infiltration is mainly a function <strong>of</strong> soil hydraulic conductivity, <strong>the</strong> rateat which water moves through <strong>the</strong> soil; soil cracking and flood durationalso contribute. For example, in soils with low hydraulic conductivity,<strong>the</strong> depth to which flood water infiltrates is defined by <strong>the</strong> length <strong>of</strong>time <strong>the</strong> surface is inundated. Surface drainage and evapotranspirationmay deplete <strong>the</strong> storage volume be<strong>for</strong>e <strong>the</strong> soil is fully saturated.<strong>Estimating</strong> <strong>the</strong> soil moisture store <strong>for</strong> a floodplain wetland is not simple,partly because <strong>the</strong> process <strong>of</strong> infiltration varies greatly between soiltypes. For soils o<strong>the</strong>r than cracking clays, infiltration occurs by <strong>the</strong>downward advance <strong>of</strong> water through <strong>the</strong> soil pr<strong>of</strong>ile. For <strong>the</strong>se soils,<strong>the</strong> moisture store, when saturated, can be estimated as a function <strong>of</strong>soil depth and soil porosity (<strong>the</strong> proportion <strong>of</strong> <strong>the</strong> soil volumerepresented by pore spaces). When <strong>the</strong> soil moisture store is not full,<strong>for</strong> example, if infiltration has been limited by flood duration,infiltration rates and flooding duration need to be estimated. Hydraulicconductivities have been established <strong>for</strong> many soils, but <strong>the</strong> application<strong>of</strong> <strong>the</strong>se values in field situations is usually constrained by a lack <strong>of</strong> datadescribing <strong>the</strong> spatial variability in soil types. Fur<strong>the</strong>rmore, soilcracking and macro-pores can increase initial infiltration rates to orders<strong>of</strong> magnitude higher than laboratory derived values.In <strong>the</strong> Murray–Darling Basin, <strong>the</strong> lowland river floodplains on <strong>the</strong>Murray and Darling Riverine Plains are characterised by cracking clays.These soils behave very differently from lighter soils, and <strong>the</strong> infiltrationprocess is very different. As <strong>the</strong>se soils dry, deep cracks <strong>for</strong>m in <strong>the</strong> soil,sometimes <strong>for</strong>ming discrete columns <strong>of</strong> soil (Figure 19). Infiltrationoccurs as a rapid filling <strong>of</strong> <strong>the</strong>se cracks, and water subsequently moveslaterally through <strong>the</strong> soil away from <strong>the</strong> cracks. As <strong>the</strong> soils wet up, <strong>the</strong>y66 <strong>Estimating</strong> <strong>the</strong> <strong>Water</strong> <strong>Requirements</strong> <strong>for</strong> <strong>Plants</strong> <strong>of</strong> <strong>Floodplain</strong> <strong>Wetlands</strong>
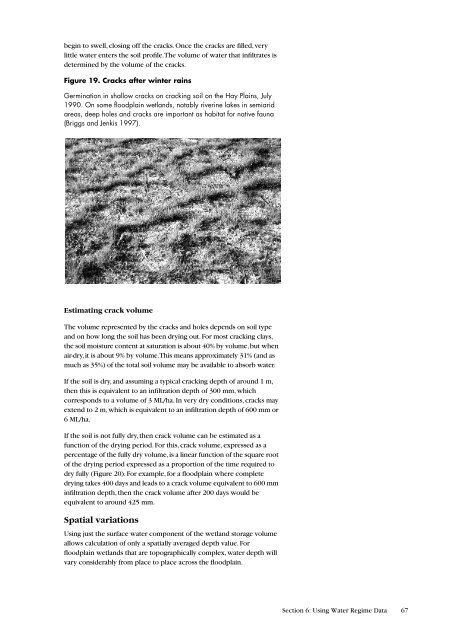
egin to swell, closing <strong>of</strong>f <strong>the</strong> cracks. Once <strong>the</strong> cracks are filled, verylittle water enters <strong>the</strong> soil pr<strong>of</strong>ile. The volume <strong>of</strong> water that infiltrates isdetermined by <strong>the</strong> volume <strong>of</strong> <strong>the</strong> cracks.Figure 19. Cracks after winter rainsGermination in shallow cracks on cracking soil on <strong>the</strong> Hay Plains, July1990. On some floodplain wetlands, notably riverine lakes in semiaridareas, deep holes and cracks are important as habitat <strong>for</strong> native fauna(Briggs and Jenkis 1997).<strong>Estimating</strong> crack volumeThe volume represented by <strong>the</strong> cracks and holes depends on soil typeand on how long <strong>the</strong> soil has been drying out. For most cracking clays,<strong>the</strong> soil moisture content at saturation is about 40% by volume, but whenair-dry, it is about 9% by volume. This means approximately 31% (and asmuch as 35%) <strong>of</strong> <strong>the</strong> total soil volume may be available to absorb water.If <strong>the</strong> soil is dry, and assuming a typical cracking depth <strong>of</strong> around 1 m,<strong>the</strong>n this is equivalent to an infiltration depth <strong>of</strong> 300 mm, whichcorresponds to a volume <strong>of</strong> 3 ML/ha. In very dry conditions, cracks mayextend to 2 m, which is equivalent to an infiltration depth <strong>of</strong> 600 mm or6 ML/ha.If <strong>the</strong> soil is not fully dry, <strong>the</strong>n crack volume can be estimated as afunction <strong>of</strong> <strong>the</strong> drying period. For this, crack volume, expressed as apercentage <strong>of</strong> <strong>the</strong> fully dry volume, is a linear function <strong>of</strong> <strong>the</strong> square root<strong>of</strong> <strong>the</strong> drying period expressed as a proportion <strong>of</strong> <strong>the</strong> time required todry fully (Figure 20). For example, <strong>for</strong> a floodplain where completedrying takes 400 days and leads to a crack volume equivalent to 600 mminfiltration depth, <strong>the</strong>n <strong>the</strong> crack volume after 200 days would beequivalent to around 425 mm.Spatial variationsUsing just <strong>the</strong> surface water component <strong>of</strong> <strong>the</strong> wetland storage volumeallows calculation <strong>of</strong> only a spatially averaged depth value. Forfloodplain wetlands that are topographically complex, water depth willvary considerably from place to place across <strong>the</strong> floodplain.Section 6: Using <strong>Water</strong> Regime Data 67
- Page 1 and 2:
Estimating the WaterRequirements fo
- Page 3 and 4:
ContentsPreface 7Acknowledgments 8G
- Page 5:
List of Tables1 Spatial variability
- Page 8 and 9:
Note that the guide is concerned pr
- Page 10 and 11:
ecomes a matter of how to use what
- Page 12 and 13:
Figure 1. Floodplain featuresThe fl
- Page 14 and 15:
Figure 4.Wanganella Swamps, souther
- Page 16 and 17: Floodplain wetlands, being a mosaic
- Page 18 and 19: Section 2:Introducing theVegetation
- Page 20 and 21: size and vigour rarely reach their
- Page 22 and 23: floodplains survive there because t
- Page 24 and 25: The lagoon floor is then colonised
- Page 26 and 27: Note 11Growth-formsField guides to
- Page 28 and 29: identical conditions. PFTs differ f
- Page 30 and 31: Note 13Changes in depthSome herbace
- Page 32 and 33: Focusing on depthWater regime analy
- Page 34 and 35: Note 15Internet dataEnvironmental d
- Page 36 and 37: Step 3: Vegetation-hydrologyrelatio
- Page 38 and 39: Note 19Modelling and time-stepsIn s
- Page 40 and 41: Section 4: Old andNew DataOne of th
- Page 42 and 43: see Figure 15), despite a three-fol
- Page 44 and 45: frequency. This is rather limiting,
- Page 46 and 47: Figure 13. Lippia, a floodplain wee
- Page 48 and 49: single measure of the vegetation to
- Page 50 and 51: Section 5:ObtainingVegetation DataW
- Page 52 and 53: However, if the chosen species has
- Page 54 and 55: Figure 15. Range of tree condition
- Page 56 and 57: Figure 16. Spatial-temporal sequenc
- Page 58 and 59: Note 26Canopy condition indexA visu
- Page 60 and 61: Note 27Mapping floodplainwetland ve
- Page 62 and 63: Shape of species responseThe shape
- Page 64 and 65: Figure 18. Heat pulse sensorHeat pu
- Page 68 and 69: Figure 20. Crack volume and drying
- Page 70 and 71: Figure 21. The relationshipbetween
- Page 72 and 73: epresentative, there should be no m
- Page 74 and 75: All of the curves are described by
- Page 76 and 77: monitoring, precision levels, scali
- Page 78 and 79: sites of significant recharge and d
- Page 80 and 81: Figure 24. Degraded channelPart of
- Page 82 and 83: and so depth estimates are inaccura
- Page 84 and 85: Section 7:PredictingVegetationRespo
- Page 86 and 87: AEAM and the Macquarie Marshes. An
- Page 88 and 89: Category 3: hydraulic/empiricalAppr
- Page 90 and 91: For example, changes in surface and
- Page 92 and 93: ReferencesPrefaceArthington AH and
- Page 94 and 95: Section 3Roberts J and Marston F (1
- Page 96 and 97: Kunin WE and Gaston KG (1993). The
- Page 98 and 99: Singh VP (1995).“Computer models
- Page 100 and 101: Web ListingsNote 40Data on the WebM
- Page 102 and 103: flood. This has not been attempted,
- Page 104 and 105: Seven points over the flow range is
- Page 106 and 107: used as exclusions; or can be quant
- Page 108 and 109: Table A1 - 4. A flooding overlay ch
- Page 110: Table A2 - 1.(cont’d) K c and K s