Note 26Canopy condition indexA visual assessment <strong>of</strong> tree canopycondition initially developed insouth-eastern Queensland <strong>for</strong>assessing health <strong>of</strong> eucalypt <strong>for</strong>ests,has been used on floodplain trees, inparticular on black box Eucalyptuslargiflorens.The original index (Grimes 1987)was in four parts: crown size, crowndensity, dead branches andepicormic growth. Modifications bydifferent users to make this moresuitable <strong>for</strong> ecological purposesmake it difficult to comparefloodplains. None<strong>the</strong>less, <strong>the</strong> indexhas proven useful so continues to beused.In modified <strong>for</strong>m, this index hasbeen used <strong>for</strong> E. largiflorens on <strong>the</strong>Mirrool Creek floodplain (Robertsand Wylks 1992) and on <strong>the</strong> Chowillafloodplain (Jolly et al. 1996).Estimates <strong>of</strong> tree health have beenused to assess and monitor noneucalyptspecies around wetlands inWestern Australia (Froend et al.1987).<strong>the</strong> o<strong>the</strong>r is oxygen deprivation in <strong>the</strong> root zone, resulting in reducedphotosyn<strong>the</strong>sis, possibly phytotoxin trauma in <strong>the</strong> roots and evenculms, stunted roots, and reduced nutrient uptake. Symptoms <strong>for</strong>established plants include leaf-burning, leaf-shedding, prematurecanopy senescence, stunted growth, reduced reserves and dieback <strong>of</strong>branches. All <strong>the</strong>se can be detected at <strong>the</strong> species level.Sustained stress, such as altered water regime, affects plant vigour. Thiscan alter competitive interactions between species, or even alterdominance and so create an opportunity <strong>for</strong> o<strong>the</strong>r species. At <strong>the</strong>community level, this can be detected as a change in area, by shifts incommunity boundaries, and by increased incidence <strong>of</strong> opportunisticspecies or <strong>of</strong> species more closely associated with <strong>the</strong> ‘new’ conditions,whe<strong>the</strong>r <strong>the</strong>y be drier or wetter. Thus, measures <strong>of</strong> communitycondition can include presence and abundance or area <strong>of</strong> invasivespecies. An indicator species may point to wetter conditions, or drierconditions, or seasonal shifts. Useful examples <strong>of</strong> indicator species fromeastern Australia are cumbungi Typha spp. <strong>for</strong> wet conditions, andlippia Phyla canescens <strong>for</strong> drier conditions (Figure 13). Indicatorspecies need to be clearly associated with <strong>the</strong> change, and not withano<strong>the</strong>r environmental condition, such as stock grazing: someunpalatable Juncus species increase under grazing pressure.For species and community, lack <strong>of</strong> regeneration is a serious long-termloss <strong>of</strong> vigour. In choosing lack <strong>of</strong> regeneration as a measure (eg. lack <strong>of</strong>seedlings, no juveniles or saplings, only ageing and senescent treespresent), it will be necessary to establish that this is an outcome <strong>of</strong>water regime alone or in combination with something else, and not <strong>the</strong>result <strong>of</strong> o<strong>the</strong>r factors such as rabbits.Condition and growth-<strong>for</strong>mLeaves are <strong>the</strong> basic unit <strong>of</strong> growth <strong>for</strong> most plants so are also a goodstarting point to assess plant vigour and condition. Some aspects <strong>of</strong> leafvigour are common across growth-<strong>for</strong>ms. For example, it is a useful butsimplistic assumption that a plant with larger leaves, or greaterphotosyn<strong>the</strong>tic area (more leaves, higher LAI) will be in better healththan a plant with smaller photosyn<strong>the</strong>tic area or which has some leafarea that is not fully photosyn<strong>the</strong>tic (yellowing, brown spots, deadleaves) or that is damaged or incomplete (insect damage, leaves beingshed, burnt). Condition <strong>of</strong> leaves can be assessed remotely, using NDVI(Note 25) or assessed from <strong>the</strong> ground using indices <strong>of</strong> canopy vigour(Note 26), or its physiological condition measured in <strong>the</strong> field.Many <strong>of</strong> <strong>the</strong> methods <strong>for</strong> measuring vigour have been developed <strong>for</strong>agricultural or <strong>for</strong>estry species. Consequently, <strong>the</strong> techniques andequipment <strong>for</strong> estimating health and vigour are better developed <strong>for</strong>floodplain trees than <strong>for</strong> o<strong>the</strong>r growth-<strong>for</strong>ms, especially aquatic species.There are few means <strong>for</strong> measuring <strong>the</strong> health and vigour <strong>of</strong> leaflessspecies (see below).TreesCanopy condition index. A visual assessment <strong>of</strong> canopy condition iscompared with reference material, <strong>the</strong>n scored. When using suchindices, it is important to use printed reference material in <strong>the</strong> fieldthroughout <strong>the</strong> investigation in order to standardise observations. It isalso essential to identify examples <strong>of</strong> <strong>the</strong> full condition range, from deador very poor to vigorous (Figure 15). Canopy indices are ordinal data,58 <strong>Estimating</strong> <strong>the</strong> <strong>Water</strong> <strong>Requirements</strong> <strong>for</strong> <strong>Plants</strong> <strong>of</strong> <strong>Floodplain</strong> <strong>Wetlands</strong>
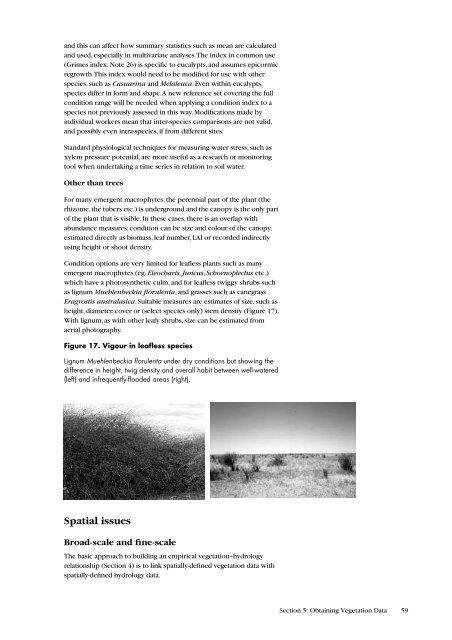
and this can affect how summary statistics such as mean are calculatedand used, especially in multivariate analyses. The index in common use(Grimes index; Note 26) is specific to eucalypts, and assumes epicormicregrowth. This index would need to be modified <strong>for</strong> use with o<strong>the</strong>rspecies, such as Casuarina and Melaleuca. Even within eucalypts,species differ in <strong>for</strong>m and shape. A new reference set covering <strong>the</strong> fullcondition range will be needed when applying a condition index to aspecies not previously assessed in this way. Modifications made byindividual workers mean that inter-species comparisons are not valid,and possibly even intra-species, if from different sites.Standard physiological techniques <strong>for</strong> measuring water stress, such asxylem pressure potential, are more useful as a research or monitoringtool when undertaking a time series in relation to soil water.O<strong>the</strong>r than treesFor many emergent macrophytes, <strong>the</strong> perennial part <strong>of</strong> <strong>the</strong> plant (<strong>the</strong>rhizome, <strong>the</strong> tubers etc.) is underground and <strong>the</strong> canopy is <strong>the</strong> only part<strong>of</strong> <strong>the</strong> plant that is visible. In <strong>the</strong>se cases, <strong>the</strong>re is an overlap withabundance measures; condition can be size and colour <strong>of</strong> <strong>the</strong> canopy,estimated directly as biomass, leaf number, LAI or recorded indirectlyusing height or shoot density.Condition options are very limited <strong>for</strong> leafless plants such as manyemergent macrophytes (eg. Eleocharis, Juncus, Schoenoplectus etc.)which have a photosyn<strong>the</strong>tic culm, and <strong>for</strong> leafless twiggy shrubs suchas lignum Muehlenbeckia florulenta, and grasses such as canegrassEragrostis australasica. Suitable measures are estimates <strong>of</strong> size, such asheight, diameter, cover or (select species only) stem density (Figure 17).With lignum, as with o<strong>the</strong>r leafy shrubs, size can be estimated fromaerial photography.Figure 17. Vigour in leafless speciesLignum Muehlenbeckia florulenta under dry conditions but showing <strong>the</strong>difference in height, twig density and overall habit between well-watered(left) and infrequently-flooded areas (right).Spatial issuesBroad-scale and fine-scaleThe basic approach to building an empirical vegetation–hydrologyrelationship (Section 4) is to link spatially-defined vegetation data withspatially-defined hydrology data.Section 5: Obtaining Vegetation Data 59
- Page 1 and 2:
Estimating the WaterRequirements fo
- Page 3 and 4:
ContentsPreface 7Acknowledgments 8G
- Page 5:
List of Tables1 Spatial variability
- Page 8 and 9: Note that the guide is concerned pr
- Page 10 and 11: ecomes a matter of how to use what
- Page 12 and 13: Figure 1. Floodplain featuresThe fl
- Page 14 and 15: Figure 4.Wanganella Swamps, souther
- Page 16 and 17: Floodplain wetlands, being a mosaic
- Page 18 and 19: Section 2:Introducing theVegetation
- Page 20 and 21: size and vigour rarely reach their
- Page 22 and 23: floodplains survive there because t
- Page 24 and 25: The lagoon floor is then colonised
- Page 26 and 27: Note 11Growth-formsField guides to
- Page 28 and 29: identical conditions. PFTs differ f
- Page 30 and 31: Note 13Changes in depthSome herbace
- Page 32 and 33: Focusing on depthWater regime analy
- Page 34 and 35: Note 15Internet dataEnvironmental d
- Page 36 and 37: Step 3: Vegetation-hydrologyrelatio
- Page 38 and 39: Note 19Modelling and time-stepsIn s
- Page 40 and 41: Section 4: Old andNew DataOne of th
- Page 42 and 43: see Figure 15), despite a three-fol
- Page 44 and 45: frequency. This is rather limiting,
- Page 46 and 47: Figure 13. Lippia, a floodplain wee
- Page 48 and 49: single measure of the vegetation to
- Page 50 and 51: Section 5:ObtainingVegetation DataW
- Page 52 and 53: However, if the chosen species has
- Page 54 and 55: Figure 15. Range of tree condition
- Page 56 and 57: Figure 16. Spatial-temporal sequenc
- Page 60 and 61: Note 27Mapping floodplainwetland ve
- Page 62 and 63: Shape of species responseThe shape
- Page 64 and 65: Figure 18. Heat pulse sensorHeat pu
- Page 66 and 67: section, using storage volume and i
- Page 68 and 69: Figure 20. Crack volume and drying
- Page 70 and 71: Figure 21. The relationshipbetween
- Page 72 and 73: epresentative, there should be no m
- Page 74 and 75: All of the curves are described by
- Page 76 and 77: monitoring, precision levels, scali
- Page 78 and 79: sites of significant recharge and d
- Page 80 and 81: Figure 24. Degraded channelPart of
- Page 82 and 83: and so depth estimates are inaccura
- Page 84 and 85: Section 7:PredictingVegetationRespo
- Page 86 and 87: AEAM and the Macquarie Marshes. An
- Page 88 and 89: Category 3: hydraulic/empiricalAppr
- Page 90 and 91: For example, changes in surface and
- Page 92 and 93: ReferencesPrefaceArthington AH and
- Page 94 and 95: Section 3Roberts J and Marston F (1
- Page 96 and 97: Kunin WE and Gaston KG (1993). The
- Page 98 and 99: Singh VP (1995).“Computer models
- Page 100 and 101: Web ListingsNote 40Data on the WebM
- Page 102 and 103: flood. This has not been attempted,
- Page 104 and 105: Seven points over the flow range is
- Page 106 and 107: used as exclusions; or can be quant
- Page 108 and 109:
Table A1 - 4. A flooding overlay ch
- Page 110:
Table A2 - 1.(cont’d) K c and K s