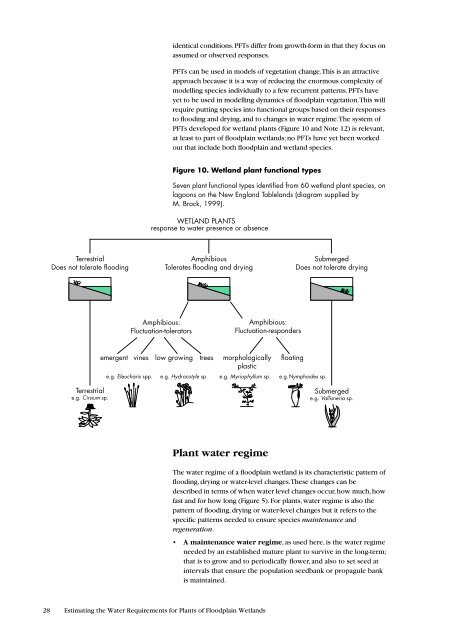
identical conditions. PFTs differ from growth-<strong>for</strong>m in that <strong>the</strong>y focus onassumed or observed responses.PFTs can be used in models <strong>of</strong> vegetation change. This is an attractiveapproach because it is a way <strong>of</strong> reducing <strong>the</strong> enormous complexity <strong>of</strong>modelling species individually to a few recurrent patterns. PFTs haveyet to be used in modelling dynamics <strong>of</strong> floodplain vegetation. This willrequire putting species into functional groups based on <strong>the</strong>ir responsesto flooding and drying, and to changes in water regime. The system <strong>of</strong>PFTs developed <strong>for</strong> wetland plants (Figure 10 and Note 12) is relevant,at least to part <strong>of</strong> floodplain wetlands; no PFTs have yet been workedout that include both floodplain and wetland species.Figure 10. Wetland plant functional typesSeven plant functional types identified from 60 wetland plant species, onlagoons on <strong>the</strong> New England Tablelands (diagram supplied byM. Brock, 1999).WETLAND PLANTSresponse to water presence or absenceTerrestrialDoes not tolerate floodingAmphibiousTolerates flooding and dryingSubmergedDoes not tolerate dryingAmphibious:Fluctuation-toleratorsAmphibious:Fluctuation-respondersTerrestriale.g. Cirsium sp.emergent vines low growing treese.g. Eleocharis spp.e.g. Hydrocotyle sp.morphologicallyplastice.g. Myriophyllum sp.floatinge.g.Nymphoides sp.Submergede.g. Vallisneria sp.Plant water regimeThe water regime <strong>of</strong> a floodplain wetland is its characteristic pattern <strong>of</strong>flooding, drying or water-level changes. These changes can bedescribed in terms <strong>of</strong> when water level changes occur, how much, howfast and <strong>for</strong> how long (Figure 5). For plants, water regime is also <strong>the</strong>pattern <strong>of</strong> flooding, drying or water-level changes but it refers to <strong>the</strong>specific patterns needed to ensure species maintenance andregeneration.• A maintenance water regime, as used here, is <strong>the</strong> water regimeneeded by an established mature plant to survive in <strong>the</strong> long-term;that is to grow and to periodically flower, and also to set seed atintervals that ensure <strong>the</strong> population seedbank or propagule bankis maintained.28 <strong>Estimating</strong> <strong>the</strong> <strong>Water</strong> <strong>Requirements</strong> <strong>for</strong> <strong>Plants</strong> <strong>of</strong> <strong>Floodplain</strong> <strong>Wetlands</strong>
• A regeneration water regime is one that ensures periodicestablishment or re-establishment <strong>of</strong> plants, whe<strong>the</strong>r from seed orfrom o<strong>the</strong>r propagules. If from seed, <strong>the</strong>n <strong>the</strong> regeneration waterregime must satisfy conditions <strong>for</strong> seed germination followed bysuccessful seedling establishment; if from propagules, <strong>the</strong>n <strong>the</strong>reare similar requirements <strong>for</strong> initial or follow-on conditions,although <strong>the</strong>se may be subtly different.Maintenance and regeneration requirements are usually quite different.The environmental conditions required <strong>for</strong> germination, or <strong>for</strong> survival<strong>of</strong> a seedling, are not <strong>the</strong> same as those required by <strong>the</strong> adult plant. Forexample, many emergent macrophytes germinate on wet muds,comparable to drawdown conditions; only some have seedlings that cantolerate submergence. Shallow water is likely to be detrimental, at leastuntil <strong>the</strong> plant reaches a critical stage: in contrast, adult plants cantolerate water depths ranging from 0 to about 1.5 metres.Components <strong>of</strong> plant water regime<strong>Water</strong> regime refers to <strong>the</strong> hydrograph shape and size, and <strong>the</strong> pattern<strong>of</strong> hydrographs through time. Size and shape characteristics arecorrelated under natural conditions, but this can change once a river isregulated or its flow regime modified. Describing a hydrograph shapeand <strong>the</strong> pattern <strong>of</strong> hydrographs through time in terms <strong>of</strong> its componentsis useful, in terms <strong>of</strong> clarifying plant responses. Seven components canbe recognised (see below): <strong>of</strong> <strong>the</strong>se, <strong>the</strong> most frequently studied aredepth and frequency.Depth: The importance <strong>of</strong> depth and <strong>the</strong> effects <strong>of</strong> changing depth arevery much dependent on species growth-<strong>for</strong>m and size. <strong>Plants</strong> withrigid or erect aerial leaves, such as emergent macrophytes, seedlings andtussock grasses, can grow in water to a certain depth, depending on<strong>the</strong>ir height or size. Equally, <strong>the</strong>y can tolerate an increase in waterdepth, provided a reasonable proportion <strong>of</strong> <strong>the</strong> canopy or stem is notsubmerged, o<strong>the</strong>rwise <strong>the</strong>y become stressed or may even die (Note 13).Thus, although depth is measured in absolute terms, in millimetres ormetres, <strong>the</strong> ecological effect on <strong>the</strong>se plants depends on <strong>the</strong> size <strong>of</strong> <strong>the</strong>species in question. Floating-leafed plants with flexible petioles cangrow in water up to two metres deep, depending on how effectively <strong>the</strong>rhizome is ventilated from <strong>the</strong> leaf, and can tolerate fluctuations inwater level, roughly <strong>of</strong> 10–20 cm, such as caused by wind-inducedwaves. Free-floating and submerged <strong>for</strong>ms are not greatly affected byincreases in depth, unless this causes a reduction in light.Note 12PFTs on TablelandlagoonsThe first Australian study <strong>of</strong> wetlandPFTs was done on isolated lagoonson <strong>the</strong> New England Tablelands.Seven PFTs were defined in terms <strong>of</strong><strong>the</strong>ir response to water regime(Brock and Casanova 1997).These seven PFTs were empiricallydetermined by a combination <strong>of</strong>experiment and observation <strong>of</strong> 60wetland plants. The lagoons havevariable water levels and anintermittent water regime, and <strong>the</strong>littoral zone, being periodicallyexposed and submerged, means<strong>the</strong>se lagoons are a variable andunpredictable environment in whichto grow and <strong>the</strong> complete plant lifecycle.Several <strong>of</strong> <strong>the</strong> 60 species used in thisstudy are also found on inlandfloodplains, but dominant floodplainspecies are not included.An alternative system <strong>of</strong> wetland PFTshas been developed in North Americabut not yet applied in Australia. Thisrecognises three main plant types:ruderal, matrix, and interstitial: it isuseful <strong>for</strong> disturbance ra<strong>the</strong>r thanwater regime (Boutin and Keddy1993).Duration <strong>of</strong> inundation: Duration refers to <strong>the</strong> time that surfacewater is present, measured in weeks or months. Duration is important<strong>for</strong> obligate aquatics as it defines <strong>the</strong> potential growing period <strong>for</strong> adults,including flowering and seed-set or storage, or <strong>the</strong> time frame <strong>for</strong>germination and seed-set if an annual. For facultative aquatics or thosetolerant <strong>of</strong> mud-flats, conditions may be favourable <strong>for</strong> growth even after<strong>the</strong>re is no more surface water, <strong>for</strong> as long as <strong>the</strong> soils remainwaterlogged or moist. For floodplain species, duration <strong>of</strong> floodingdefines <strong>the</strong> period when soil water is recharged by infiltration.Season <strong>of</strong> flooding: Season, or timing, here refers to when floodingbegins. Season is significant because it is a short-hand way to refer to acombination <strong>of</strong> climatic factors that affects plants: temperature, daylength,and whe<strong>the</strong>r day-length is increasing or decreasing. Temperaturedetermines <strong>the</strong> rate <strong>of</strong> physiological processes, evident as growth;Section 2: Introducing <strong>the</strong> Vegetation 29
- Page 1 and 2: Estimating the WaterRequirements fo
- Page 3 and 4: ContentsPreface 7Acknowledgments 8G
- Page 5: List of Tables1 Spatial variability
- Page 8 and 9: Note that the guide is concerned pr
- Page 10 and 11: ecomes a matter of how to use what
- Page 12 and 13: Figure 1. Floodplain featuresThe fl
- Page 14 and 15: Figure 4.Wanganella Swamps, souther
- Page 16 and 17: Floodplain wetlands, being a mosaic
- Page 18 and 19: Section 2:Introducing theVegetation
- Page 20 and 21: size and vigour rarely reach their
- Page 22 and 23: floodplains survive there because t
- Page 24 and 25: The lagoon floor is then colonised
- Page 26 and 27: Note 11Growth-formsField guides to
- Page 30 and 31: Note 13Changes in depthSome herbace
- Page 32 and 33: Focusing on depthWater regime analy
- Page 34 and 35: Note 15Internet dataEnvironmental d
- Page 36 and 37: Step 3: Vegetation-hydrologyrelatio
- Page 38 and 39: Note 19Modelling and time-stepsIn s
- Page 40 and 41: Section 4: Old andNew DataOne of th
- Page 42 and 43: see Figure 15), despite a three-fol
- Page 44 and 45: frequency. This is rather limiting,
- Page 46 and 47: Figure 13. Lippia, a floodplain wee
- Page 48 and 49: single measure of the vegetation to
- Page 50 and 51: Section 5:ObtainingVegetation DataW
- Page 52 and 53: However, if the chosen species has
- Page 54 and 55: Figure 15. Range of tree condition
- Page 56 and 57: Figure 16. Spatial-temporal sequenc
- Page 58 and 59: Note 26Canopy condition indexA visu
- Page 60 and 61: Note 27Mapping floodplainwetland ve
- Page 62 and 63: Shape of species responseThe shape
- Page 64 and 65: Figure 18. Heat pulse sensorHeat pu
- Page 66 and 67: section, using storage volume and i
- Page 68 and 69: Figure 20. Crack volume and drying
- Page 70 and 71: Figure 21. The relationshipbetween
- Page 72 and 73: epresentative, there should be no m
- Page 74 and 75: All of the curves are described by
- Page 76 and 77: monitoring, precision levels, scali
- Page 78 and 79:
sites of significant recharge and d
- Page 80 and 81:
Figure 24. Degraded channelPart of
- Page 82 and 83:
and so depth estimates are inaccura
- Page 84 and 85:
Section 7:PredictingVegetationRespo
- Page 86 and 87:
AEAM and the Macquarie Marshes. An
- Page 88 and 89:
Category 3: hydraulic/empiricalAppr
- Page 90 and 91:
For example, changes in surface and
- Page 92 and 93:
ReferencesPrefaceArthington AH and
- Page 94 and 95:
Section 3Roberts J and Marston F (1
- Page 96 and 97:
Kunin WE and Gaston KG (1993). The
- Page 98 and 99:
Singh VP (1995).“Computer models
- Page 100 and 101:
Web ListingsNote 40Data on the WebM
- Page 102 and 103:
flood. This has not been attempted,
- Page 104 and 105:
Seven points over the flow range is
- Page 106 and 107:
used as exclusions; or can be quant
- Page 108 and 109:
Table A1 - 4. A flooding overlay ch
- Page 110:
Table A2 - 1.(cont’d) K c and K s