Sustained Innovation and Creativity - Toyota Industries Corporation
Sustained Innovation and Creativity - Toyota Industries Corporation
Sustained Innovation and Creativity - Toyota Industries Corporation

You also want an ePaper? Increase the reach of your titles
YUMPU automatically turns print PDFs into web optimized ePapers that Google loves.
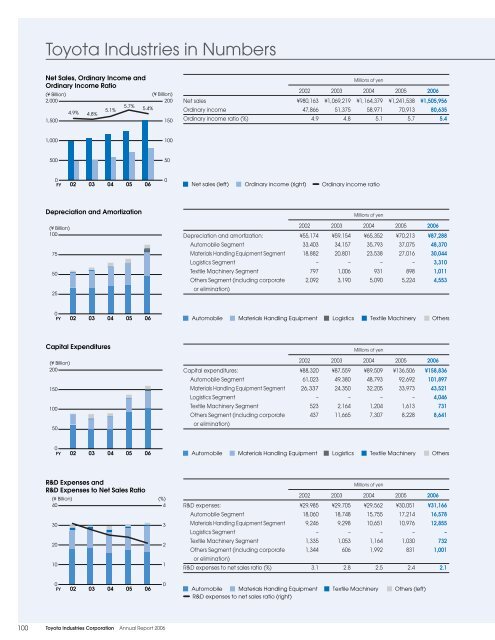
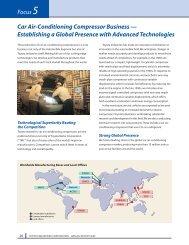
<strong>Toyota</strong> <strong>Industries</strong> in NumbersNet Sales, Ordinary Income <strong>and</strong>Ordinary Income Ratio(¥ Billion)2,0001,5004.9% 4.8%5.1%5.7%5.4%(¥ Billion)2001502002 2003Millions of yen2004 2005 2006Net sales ¥980,163 ¥1,069,219 ¥1,164,379 ¥1,241,538 ¥1,505,956Ordinary income 47,866 51,375 58,971 70,913 80,635Ordinary income ratio (%) 4.9 4.8 5.1 5.7 5.41,000100500500FY02030405 060Net sales (left)Ordinary income (right)Ordinary income ratioDepreciation <strong>and</strong> Amortization(¥ Billion)1007550252002 2003Millions of yen2004 2005 2006Depreciation <strong>and</strong> amortization: ¥55,174 ¥59,154 ¥65,352 ¥70,213 ¥87,288Automobile Segment 33,403 34,157 35,793 37,075 48,370Materials H<strong>and</strong>ling Equipment Segment 18,882 20,801 23,538 27,016 30,044Logistics Segment – – – – 3,310Textile Machinery Segment 797 1,006 931 898 1,011Others Segment (including corporateor elimination)2,092 3,190 5,090 5,224 4,5530FY02030405 06Automobile Materials H<strong>and</strong>ling Equipment Logistics Textile Machinery OthersCapital Expenditures(¥ Billion)200150100502002 2003Millions of yen2004 2005 2006Capital expenditures: ¥88,320 ¥87,559 ¥89,509 ¥136,506 ¥158,836Automobile Segment 61,023 49,380 48,793 92,692 101,897Materials H<strong>and</strong>ling Equipment Segment 26,337 24,350 32,205 33,973 43,521Logistics Segment – – – – 4,046Textile Machinery Segment 523 2,164 1,204 1,613 731Others Segment (including corporateor elimination)437 11,665 7,307 8,228 8,6410FY 02 03 04 05 06Automobile Materials H<strong>and</strong>ling Equipment Logistics Textile Machinery OthersR&D Expenses <strong>and</strong>R&D Expenses to Net Sales Ratio(¥ Billion)40302010(%)43212002 2003Millions of yen2004 2005 2006R&D expenses: ¥29,985 ¥29,705 ¥29,562 ¥30,051 ¥31,166Automobile Segment 18,060 18,748 15,755 17,214 16,578Materials H<strong>and</strong>ling Equipment Segment 9,246 9,298 10,651 10,976 12,855Logistics Segment – – – – –Textile Machinery Segment 1,335 1,053 1,164 1,030 732Others Segment (including corporate 1,344 606 1,992 831 1,001or elimination)R&D expenses to net sales ratio (%) 3.1 2.8 2.5 2.4 2.10FY020304005 06 Automobile Materials H<strong>and</strong>ling Equipment Textile Machinery Others (left)R&D expenses to net sales ratio (right)100 <strong>Toyota</strong> <strong>Industries</strong> <strong>Corporation</strong> Annual Report 2006
![PDF[476KB/5 pages] - Toyota Industries Corporation](https://img.yumpu.com/50288545/1/190x123/pdf476kb-5-pages-toyota-industries-corporation.jpg?quality=85)
![PDF[622KB/13pages] - Toyota Industries Corporation](https://img.yumpu.com/47399131/1/190x245/pdf622kb-13pages-toyota-industries-corporation.jpg?quality=85)
![PDF[792KB/2Pages] - Toyota Industries Corporation](https://img.yumpu.com/45510108/1/184x260/pdf792kb-2pages-toyota-industries-corporation.jpg?quality=85)
![PDF[126KB/4Pages] - Toyota Industries Corporation](https://img.yumpu.com/41525474/1/184x260/pdf126kb-4pages-toyota-industries-corporation.jpg?quality=85)
![PDF[1229KB/26 pages] - Toyota Industries Corporation](https://img.yumpu.com/40908773/1/190x247/pdf1229kb-26-pages-toyota-industries-corporation.jpg?quality=85)