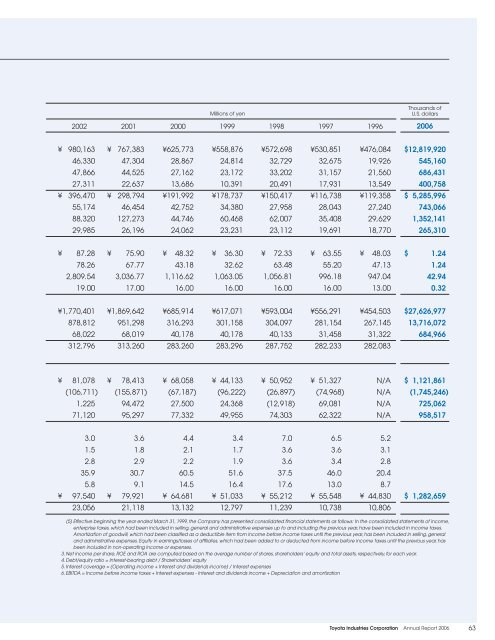
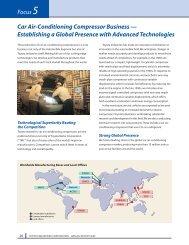
Consolidated Eleven-Year Summary<strong>Toyota</strong> <strong>Industries</strong> <strong>Corporation</strong> <strong>and</strong> Consolidated SubsidiariesYears ended March 31The fi gures in this table are unaudited.For The YearNet sales ¥1,505,956 ¥1,241,538 ¥1,164,379 ¥1,069,219Operating income 64,040 53,120 52,631 52,478Ordinary income 80,635 70,913 58,971 51,375Net income 47,077 43,358 33,623 21,934Overseas sales ¥ 620,946 ¥ 539,003 ¥ 497,357 ¥ 451,594Depreciation <strong>and</strong> amortization 87,288 70,213 65,352 59,154Capital expenditures 158,836 136,506 89,509 87,559Research <strong>and</strong> development expenses 31,166 30,051 29,562 29,705Per share of common stock (yen, U.S. dollars):Net income — basic ¥ 146.16 ¥ 135.09 ¥ 108.04 ¥ 70.19Net income — diluted 146.02 135.03 101.97 62.90Shareholders’ equity 5,044.45 3,504.80 3,199.69 2,522.52Cash dividends 38.00 32.00 24.00 22.00At Year-EndTotal assets ¥3,245,341 ¥2,326,824 ¥2,011,995 ¥1,650,391Shareholders’ equity 1,611,227 1,115,747 1,016,764 738,868Common stock 80,463 80,463 80,463 68,047Number of shares outst<strong>and</strong>ing (excluding treasury stock)(thous<strong>and</strong>s)2005 2004 2003319,320 318,237 317,666 292,777Cash FlowsNet cash provided by operating activities ¥ 131,785 ¥ 100,095 ¥ 92,406 ¥ 103,183Net cash used in investing activities (205,014) (128,231) (92,668) (95,121)Net cash provided by (used in) fi nancing activities 85,173 50,021 (56,015) 57,776Cash <strong>and</strong> cash equivalents at end of year 112,597 100,536 77,212 136,929IndicesReturn on equity (ROE) (%) 3.5 4.1 3.8 2.7Return on assets (ROA) (%) 1.7 2.0 1.8 1.3Return on sales (ROS) (%) 3.1 3.5 2.9 2.1Debt/equity ratio (%) 29.4 34.4 31.6 55.6Interest coverage (times) 7.8 7.7 7.4 6.7EBITDA (millions of yen, thous<strong>and</strong>s of U.S. dollars) ¥ 150,674 ¥ 128,381 ¥ 113,676 ¥ 95,472Number of employees at year-end 32,977 30,990 27,431 25,030Notes: 1. U.S. dollar amounts have been translated from yen, for convenience only, at the rate of ¥117.47 = US$1, the exchange rate on March 31, 2006.2. Main changes in accounting st<strong>and</strong>ards <strong>and</strong> methods during the above periods are as follows. These changes have not been applied to the fi nancial statements presentedprior to each year retroactively.(1) Effective beginning the year ended March 31, 2005, the new accounting st<strong>and</strong>ards for impairment of fi xed assets have been applied. Details are described in Notes toConsolidated Financial Statements.(2) Effective beginning the year ended March 31, 2003, the new accounting st<strong>and</strong>ards for net income per share have been applied.(3) Effective beginning the year ended March 31, 2001, the new accounting st<strong>and</strong>ards for retirement benefi ts, fi nancial instrument <strong>and</strong> foreign currency transactions havebeen applied.(4) Effective beginning the year ended March 31, 2000, <strong>Toyota</strong> <strong>Industries</strong> <strong>Corporation</strong> (the “Company”) has used the annual average exchange rate instead of the year-endrate in order to present the operating results more precisely as signifi cance of the overseas consolidated subsidiaries had been increasing <strong>and</strong> their revenue <strong>and</strong> expenseswere incurred throughout the fi scal years. The Company also has adopted tax effect accounting due to the amendment of the accounting st<strong>and</strong>ards for income taxes.Deferred tax assets have been newly recognized in current assets, <strong>and</strong> investments <strong>and</strong> other assets. Deferred tax liabilities have been recognized in current <strong>and</strong>long-term liabilities.2006Millions of yen62 <strong>Toyota</strong> <strong>Industries</strong> <strong>Corporation</strong> Annual Report 2006
Millions of yen2002 2001 2000 1999 1998 1997 1996Thous<strong>and</strong>s ofU.S. dollars2006¥ 980,163 ¥ 767,383 ¥625,773 ¥558,876 ¥572,698 ¥530,851 ¥476,08446,330 47,304 28,867 24,814 32,729 32,675 19,92647,866 44,525 27,162 23,172 33,202 31,157 21,56027,311 22,637 13,686 10,391 20,491 17,931 13,549¥ 396,470 ¥ 298,794 ¥191,992 ¥178,737 ¥150,417 ¥116,738 ¥119,35855,174 46,454 42,752 34,380 27,958 28,043 27,24088,320 127,273 44,746 60,468 62,007 35,408 29,62929,985 26,196 24,062 23,231 23,112 19,691 18,770$12,819,920545,160686,431400,758$ 5,285,996743,0661,352,141265,310¥ 87.28 ¥ 75.90 ¥ 48.32 ¥ 36.30 ¥ 72.33 ¥ 63.55 ¥ 48.0378.26 67.77 43.18 32.62 63.48 55.20 47.132,809.54 3,036.77 1,116.62 1,063.05 1,056.81 996.18 947.0419.00 17.00 16.00 16.00 16.00 16.00 13.00$ 1.241.2442.940.32¥1,770,401 ¥1,869,642 ¥685,914 ¥617,071 ¥593,004 ¥556,291 ¥454,503878,812 951,298 316,293 301,158 304,097 281,154 267,14568,022 68,019 40,178 40,178 40,133 31,458 31,322312,796 313,260 283,260 283,296 287,752 282,233 282,083$27,626,97713,716,072684,966¥ 81,078 ¥ 78,413 ¥ 68,058 ¥ 44,133 ¥ 50,952 ¥ 51,327 N/A(106,711) (155,871) (67,187) (96,222) (26,897) (74,968) N/A1,225 94,472 27,500 24,368 (12,918) 69,081 N/A71,120 95,297 77,332 49,955 74,303 62,322 N/A$ 1,121,861(1,745,246)725,062958,5173.0 3.6 4.4 3.4 7.0 6.5 5.21.5 1.8 2.1 1.7 3.6 3.6 3.12.8 2.9 2.2 1.9 3.6 3.4 2.835.9 30.7 60.5 51.6 37.5 46.0 20.45.8 9.1 14.5 16.4 17.6 13.0 8.7¥ 97,540 ¥ 79,921 ¥ 64,681 ¥ 51,033 ¥ 55,212 ¥ 55,548 ¥ 44,83023,056 21,118 13,132 12,797 11,239 10,738 10,806$ 1,282,659(5) Effective beginning the year ended March 31, 1999, the Company has presented consolidated fi nancial statements as follows: In the consolidated statements of income,enterprise taxes, which had been included in selling, general <strong>and</strong> administrative expenses up to <strong>and</strong> including the previous year, have been included in income taxes.Amortization of goodwill, which had been classifi ed as a deductible item from income before income taxes until the previous year, has been included in selling, general<strong>and</strong> administrative expenses. Equity in earnings/losses of affi liates, which had been added to or deducted from income before income taxes until the previous year, hasbeen included in non-operating income or expenses.3. Net income per share, ROE <strong>and</strong> ROA are computed based on the average number of shares, shareholders’ equity <strong>and</strong> total assets, respectively, for each year.4. Debt/equity ratio = Interest-bearing debt / Shareholders’ equity5. Interest coverage = (Operating income + Interest <strong>and</strong> dividends income) / Interest expenses6. EBITDA = Income before income taxes + Interest expenses - Interest <strong>and</strong> dividends income + Depreciation <strong>and</strong> amortization<strong>Toyota</strong> <strong>Industries</strong> <strong>Corporation</strong> Annual Report 200663


![PDF[476KB/5 pages] - Toyota Industries Corporation](https://img.yumpu.com/50288545/1/190x123/pdf476kb-5-pages-toyota-industries-corporation.jpg?quality=85)
![PDF[622KB/13pages] - Toyota Industries Corporation](https://img.yumpu.com/47399131/1/190x245/pdf622kb-13pages-toyota-industries-corporation.jpg?quality=85)
![PDF[792KB/2Pages] - Toyota Industries Corporation](https://img.yumpu.com/45510108/1/184x260/pdf792kb-2pages-toyota-industries-corporation.jpg?quality=85)
![PDF[126KB/4Pages] - Toyota Industries Corporation](https://img.yumpu.com/41525474/1/184x260/pdf126kb-4pages-toyota-industries-corporation.jpg?quality=85)
![PDF[1229KB/26 pages] - Toyota Industries Corporation](https://img.yumpu.com/40908773/1/190x247/pdf1229kb-26-pages-toyota-industries-corporation.jpg?quality=85)