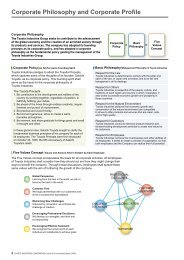
Consolidated Financial Highlights<strong>Toyota</strong> <strong>Industries</strong> <strong>Corporation</strong> <strong>and</strong> Consolidated SubsidiariesYears ended March 31For the YearMillions of yen2006 2005 2004 2003 2002%changeThous<strong>and</strong>s ofU.S. dollars2006Net sales ¥1,505,956 ¥1,241,538 ¥1,164,379 ¥1,069,219 ¥980,163 21.3% $12,819,920Operating income 64,040 53,120 52,631 52,478 46,330 20.6 545,160Ordinary income 80,635 70,913 58,971 51,375 47,866 13.7 686,431Net income 47,077 43,358 33,623 21,934 27,311 8.6 400,758Overseas sales 620,946 539,009 497,357 451,594 396,470 15.2 5,285,996Depreciation <strong>and</strong> amortization 87,288 70,213 65,352 59,154 55,174 24.3 743,066Capital expenditures 158,836 136,506 89,509 87,559 88,320 16.4 1,352,141Research <strong>and</strong> development31,166 30,051 29,562 29,705 29,985 3.7 265,310expensesPer Share Data (yen, U.S. dollars)Net income — basic ¥146.16 ¥135.09 ¥108.04 ¥70.19 ¥87.28 8.2% $1.24Net income — diluted 146.02 135.03 101.97 62.90 78.26 8.1 1.24Cash dividends 38.00 32.00 24.00 22.00 19.00 18.8 0.32At Year-EndTotal assets ¥3,245,341 ¥2,326,824 ¥2,011,995 ¥1,650,391 ¥1,770,401 39.5% $27,626,977Shareholders’ equity 1,611,227 1,115,747 1,016,764 738,868 878,812 44.4 13,716,072Number of employees 32,977 30,990 27,431 25,030 23,056 6.4Note: U.S. dollar amounts have been translated from yen, for convenience only, at the rate of 117.47 yen = US$1, the approximate exchange rate on March 31, 2006.Sales by Business SegmentNet salesMillions of yen2006 2005 2004 2003 2002Thous<strong>and</strong>s ofU.S. dollars2006Automobile ¥746,796 ¥616,200 ¥603,863 ¥595,460 ¥563,599 $6,357,334Materials H<strong>and</strong>ling Equipment 595,237 503,990 443,444 373,008 353,043 5,067,141Logistics 65,145 – – – – 554,567Textile Machinery 49,789 43,902 45,969 48,740 30,705 423,844Others 48,989 77,446 71,103 52,011 32,816 417,0342 <strong>Toyota</strong> <strong>Industries</strong> <strong>Corporation</strong> Annual Report 2006
Net SalesOperating IncomeNet Income(¥ Billion)2,000(¥ Billion)70(¥ Billion)501,5006050401,000403030205002010100FY 02 03 04 05 060FY 02 03 04 05 060FY 02 03 04 05 06Overseas Sales <strong>and</strong>Overseas Sales Ratio(¥ Billion)700(%)70Total Assets(¥ Billion)3,500Shareholders’ Equity(¥ Billion)2,000600603,000500502,5001,50040030040302,0001,5001,000200201,000500100105000FY 02 03 04 05 06Overseas sales ratio (right)00FY 02 03 04 05 060FY 02 03 04 05 06Net Income per Share (Basic)(¥)150Cash Dividends per Share <strong>and</strong>Consolidated Payout Ratio(¥)50(%)50R&D Expenses <strong>and</strong>R&D Expenses Ratio(¥ Billion)40(%)41004030403030320250201020101010FY 02 03 04 05 060FY 02 03 04 05 06Payout ratio (right)00FY 02 03 04 05 06R&D expenses to net sales ratio (right)0<strong>Toyota</strong> <strong>Industries</strong> <strong>Corporation</strong> Annual Report 20063


![PDF[476KB/5 pages] - Toyota Industries Corporation](https://img.yumpu.com/50288545/1/190x123/pdf476kb-5-pages-toyota-industries-corporation.jpg?quality=85)
![PDF[622KB/13pages] - Toyota Industries Corporation](https://img.yumpu.com/47399131/1/190x245/pdf622kb-13pages-toyota-industries-corporation.jpg?quality=85)
![PDF[792KB/2Pages] - Toyota Industries Corporation](https://img.yumpu.com/45510108/1/184x260/pdf792kb-2pages-toyota-industries-corporation.jpg?quality=85)
![PDF[126KB/4Pages] - Toyota Industries Corporation](https://img.yumpu.com/41525474/1/184x260/pdf126kb-4pages-toyota-industries-corporation.jpg?quality=85)
![PDF[1229KB/26 pages] - Toyota Industries Corporation](https://img.yumpu.com/40908773/1/190x247/pdf1229kb-26-pages-toyota-industries-corporation.jpg?quality=85)