- Page 1 and 2: financial report and accounts 2011
- Page 4 and 5: 2
- Page 6 and 7: MINISTER’S REPORTComprehens
- Page 8 and 9: THE ANNUAL REPORTTREASURER’S INTR
- Page 10 and 11: THE ANNUAL REPORTEXPLANATION OF THE
- Page 12 and 13: THE ANNUAL REPORTEXPLANATION OF THE
- Page 14 and 15: THE ANNUAL REPORTEXPLANATION OF THE
- Page 16 and 17: THE ANNUAL REPORTTHE STATES OF JERS
- Page 18 and 19: THE ANNUAL REPORTCOMPARISON OF RESU
- Page 20 and 21: THE ANNUAL REPORTCOMPARISON OF RESU
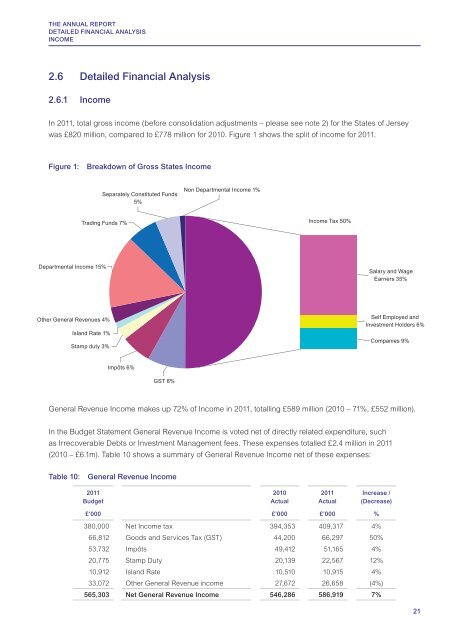
- Page 24 and 25: THE ANNUAL REPORTDETAILED FINANCIAL
- Page 26 and 27: THE ANNUAL REPORTDETAILED FINANCIAL
- Page 28 and 29: THE ANNUAL REPORTDETAILED FINANCIAL
- Page 30 and 31: THE ANNUAL REPORTDETAILED FINANCIAL
- Page 32 and 33: THE ANNUAL REPORTSUMMARY OF CURRENT
- Page 34 and 35: THE ANNUAL REPORTSUMMARY OF CURRENT
- Page 36 and 37: THE ANNUAL REPORTSUMMARY OF CURRENT
- Page 38 and 39: THE ANNUAL REPORTGOVERNANCE STRUCTU
- Page 40 and 41: THE ANNUAL REPORTGOVERNANCE STRUCTU
- Page 42 and 43: THE ANNUAL REPORTGOVERNANCE STRUCTU
- Page 44 and 45: THE ANNUAL REPORTCORPORATE SOCIAL R
- Page 46 and 47: STATEMENT OF RESPONSIBILITIES FOR T
- Page 48 and 49: REMUNERATION REPORTACCOUNTING OFFIC
- Page 50 and 51: REMUNERATION REPORTACCOUNTING OFFIC
- Page 52 and 53: STATEMENT ON INTERNAL CONTROL FOR T
- Page 55 and 56: STATEMENT ON INTERNAL CONTROL FOR T
- Page 57 and 58: STATEMENT ON INTERNAL CONTROL FOR T
- Page 59 and 60: STATEMENT ON INTERNAL CONTROL FOR T
- Page 61 and 62: STATEMENT ON INTERNAL CONTROL FOR T
- Page 63 and 64: STATEMENT ON INTERNAL CONTROL FOR T
- Page 65 and 66: INTRODUCTION TO THE ACCOUNTSCHANGES
- Page 67 and 68: INTRODUCTION TO THE ACCOUNTSEXPLANA
- Page 69 and 70: PRIMARY STATEMENTSCONSOLIDATED OPER
- Page 71 and 72: PRIMARY STATEMENTSCONSOLIDATED BALA
- Page 73 and 74:
NOTES TO THE ACCOUNTSNOTE 1: STATEM
- Page 75 and 76:
NOTES TO THE ACCOUNTSNOTE 1: STATEM
- Page 77 and 78:
NOTES TO THE ACCOUNTSNOTE 1: STATEM
- Page 79 and 80:
NOTES TO THE ACCOUNTSNOTE 1: STATEM
- Page 81 and 82:
NOTES TO THE ACCOUNTSNOTE 1: STATEM
- Page 83 and 84:
NOTES TO THE ACCOUNTSNOTE 1: STATEM
- Page 85 and 86:
NOTES TO THE ACCOUNTSNOTE 1: STATEM
- Page 87 and 88:
NOTES TO THE ACCOUNTSNOTE 1: STATEM
- Page 89 and 90:
NOTES TO THE ACCOUNTSNOTE 1: STATEM
- Page 91 and 92:
NOTES TO THE ACCOUNTSNOTE 1: STATEM
- Page 93 and 94:
NOTES TO THE ACCOUNTSNOTE 2: SEGMEN
- Page 95 and 96:
NOTES TO THE ACCOUNTSNOTE 4: EXPEND
- Page 97 and 98:
NOTES TO THE ACCOUNTSNOTE 6: NON-CA
- Page 99 and 100:
NOTES TO THE ACCOUNTSNOTE 8: OTHER
- Page 101 and 102:
NOTES TO THE ACCOUNTSNOTE 9: TANGIB
- Page 103 and 104:
NOTES TO THE ACCOUNTSNOTE 11: AVAIL
- Page 105 and 106:
NOTES TO THE ACCOUNTSNOTE 11: AVAIL
- Page 107 and 108:
NOTES TO THE ACCOUNTSNOTE 12: INVES
- Page 109 and 110:
NOTES TO THE ACCOUNTSNOTE 14: DEBTO
- Page 111 and 112:
NOTES TO THE ACCOUNTSNOTE 16: CREDI
- Page 113 and 114:
NOTES TO THE ACCOUNTSNOTE 18: FINAN
- Page 115 and 116:
NOTES TO THE ACCOUNTSNOTE 20: DERIV
- Page 117 and 118:
NOTES TO THE ACCOUNTSNOTE 21: OTHER
- Page 119 and 120:
NOTES TO THE ACCOUNTSNOTE 22: PENSI
- Page 121 and 122:
NOTES TO THE ACCOUNTSNOTE 22: PENSI
- Page 123 and 124:
NOTES TO THE ACCOUNTSNOTE 22: PENSI
- Page 125 and 126:
NOTES TO THE ACCOUNTSNOTE 22: PENSI
- Page 127 and 128:
NOTES TO THE ACCOUNTSNOTE 22: PENSI
- Page 129 and 130:
NOTES TO THE ACCOUNTSNOTE 22: PENSI
- Page 131 and 132:
NOTES TO THE ACCOUNTSNOTE 24: RESER
- Page 133 and 134:
NOTES TO THE ACCOUNTSNOTE 25: NOTES
- Page 135 and 136:
NOTES TO THE ACCOUNTSNOTE 27: THIRD
- Page 137 and 138:
NOTES TO THE ACCOUNTSNOTE 29: RISK
- Page 139 and 140:
NOTES TO THE ACCOUNTSNOTE 29: RISK
- Page 141 and 142:
NOTES TO THE ACCOUNTSNOTE 29: RISK
- Page 143 and 144:
NOTES TO THE ACCOUNTSNOTE 30: SOJ C
- Page 145 and 146:
NOTES TO THE ACCOUNTSNOTE 30: SOJ C
- Page 147 and 148:
NOTES TO THE ACCOUNTSNOTE 30: SOJ C
- Page 149 and 150:
NOTES TO THE ACCOUNTSNOTE 30: SOJ C
- Page 151 and 152:
NOTES TO THE ACCOUNTSNOTE 32: PENSI
- Page 153 and 154:
NOTES TO THE ACCOUNTSNOTE 32: PENSI
- Page 155 and 156:
NOTES TO THE ACCOUNTSNOTE 32: PENSI
- Page 157 and 158:
NOTES TO THE ACCOUNTSNOTE 32: PENSI
- Page 159 and 160:
NOTES TO THE ACCOUNTSNOTE 34: GIFTS
- Page 161 and 162:
NOTES TO THE ACCOUNTSNOTE 35: GRANT
- Page 163 and 164:
NOTES TO THE ACCOUNTSNOTE 36: RELAT
- Page 165 and 166:
NOTES TO THE ACCOUNTSNOTE 36: RELAT
- Page 167 and 168:
NOTES TO THE ACCOUNTSNOTE 37: ENTIT
- Page 169 and 170:
NOTES TO THE ACCOUNTSNOTE 37: ENTIT
- Page 171:
States of Jersey TreasuryCyril Le M