FINANCIAL REPORT AND ACCOUNTS 2011 - States Assembly
FINANCIAL REPORT AND ACCOUNTS 2011 - States Assembly
FINANCIAL REPORT AND ACCOUNTS 2011 - States Assembly

Create successful ePaper yourself
Turn your PDF publications into a flip-book with our unique Google optimized e-Paper software.
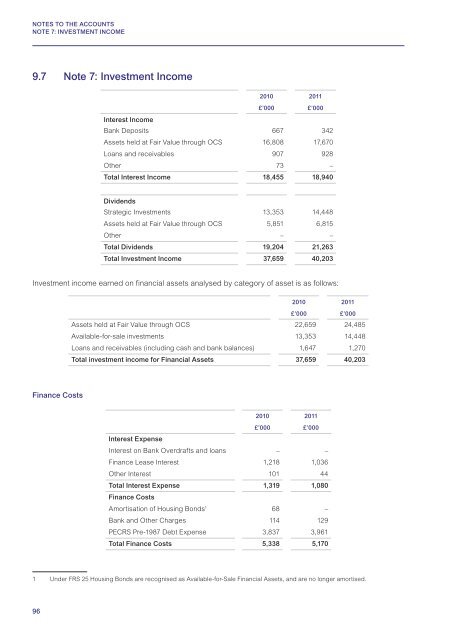
NOTES TO THE <strong>ACCOUNTS</strong>NOTE 7: INVESTMENT INCOME9.7 Note 7: Investment Income2010 <strong>2011</strong>£’000 £’000Interest IncomeBank Deposits 667 342Assets held at Fair Value through OCS 16,808 17,670Loans and receivables 907 928Other 73 –Total Interest Income 18,455 18,940DividendsStrategic Investments 13,353 14,448Assets held at Fair Value through OCS 5,851 6,815Other – –Total Dividends 19,204 21,263Total Investment Income 37,659 40,203Investment income earned on financial assets analysed by category of asset is as follows:2010 <strong>2011</strong>£’000 £’000Assets held at Fair Value through OCS 22,659 24,485Available-for-sale investments 13,353 14,448Loans and receivables (including cash and bank balances) 1,647 1,270Total investment income for Financial Assets 37,659 40,203Finance Costs2010 <strong>2011</strong>£’000 £’000Interest ExpenseInterest on Bank Overdrafts and loans – –Finance Lease Interest 1,218 1,036Other Interest 101 44Total Interest Expense 1,319 1,080Finance CostsAmortisation of Housing Bonds 1 68 –Bank and Other Charges 114 129PECRS Pre-1987 Debt Expense 3,837 3,961Total Finance Costs 5,338 5,1701 Under FRS 25 Housing Bonds are recognised as Available-for-Sale Financial Assets, and are no longer amortised.96