- Page 3 and 4: Table of ContentsBackground .......
- Page 5 and 6: FiguresFigure 1: Total, Private, an
- Page 7 and 8: stakeholders involved in constructi
- Page 9 and 10: Project Objectives & ScopeThe prima
- Page 11 and 12: the review first identified the ‘
- Page 13 and 14: Social Policies Leveraged on Public
- Page 15 and 16: construction contracts that fall un
- Page 17 and 18: Similar to the Priority Access Poli
- Page 19 and 20: employ Aboriginal people, that supp
- Page 21 and 22: projects to address skills shortage
- Page 23 and 24: ecruited from the local community.
- Page 25 and 26: The contracting or delivering agenc
- Page 28 and 29: Literature ReviewEconomic Perspecti
- Page 30 and 31: innovations. These negotiations are
- Page 32 and 33: investments in general skills); and
- Page 34 and 35: Keeping this in mind, the following
- Page 36 and 37: previous section, this research app
- Page 38 and 39: Theoretical FrameworkThe theoretica
- Page 40 and 41: max{ B(e)− C(e)eThis has a unique
- Page 42 and 43: It is also useful to add a shift fa
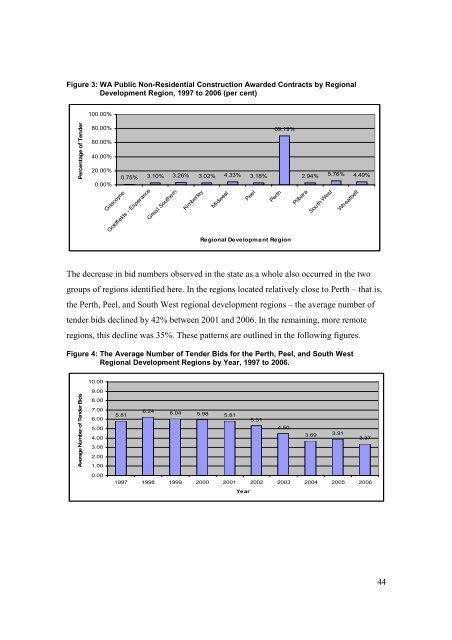
- Page 44 and 45: opposite influence - acting as a de
- Page 46 and 47: component of the economic cost of t
- Page 50 and 51: Figure 5: The Average Number of Ten
- Page 52 and 53: Figure 7: Tender Bids by Pre-Qualif
- Page 54 and 55: August 2002 (increasing by only 1.6
- Page 56 and 57: egion and project size) before focu
- Page 58 and 59: Figure 13: Average Number of Tender
- Page 60 and 61: areas as compared to less remote re
- Page 62 and 63: The results of this analysis are pr
- Page 64 and 65: the Building Skills Policy were not
- Page 66 and 67: The Training and Employment Policie
- Page 68 and 69: documentation. The Department’s k
- Page 70 and 71: And to achieve this objective, the
- Page 72 and 73: also claimed that tenders had been
- Page 74 and 75: Head ContractorsThe large sized con
- Page 76 and 77: The key policy officer in the spons
- Page 78 and 79: In summary, the information collect
- Page 80 and 81: aised the cost of construction proj
- Page 82 and 83: The Training and Employment Policie
- Page 84 and 85: commented that the 10% Training Pol
- Page 86 and 87: The sponsoring agency: DETAThe poli
- Page 88 and 89: competitive industry to operate in,
- Page 90 and 91: “There’s a disbenefit in taking
- Page 92 and 93: Several of the head contractors and
- Page 94 and 95: was defined as one were it was goin
- Page 96 and 97: However, he did link the policy to
- Page 98 and 99:
The Provision of Public Art as a Pe
- Page 100 and 101:
eport examines percent for art prog
- Page 102 and 103:
…the big question with regard to
- Page 104 and 105:
considered essential to ensure that
- Page 106 and 107:
apparatus of public hygiene or of a
- Page 108 and 109:
provide important economic benefits
- Page 110 and 111:
‘new’ approaches to such contra
- Page 112 and 113:
self education that the Artist must
- Page 114 and 115:
Building user representative 1 stat
- Page 116 and 117:
Costs according to DHW Policy Offic
- Page 118 and 119:
Numerous interviewees noted that th
- Page 120 and 121:
Additionally, the skill development
- Page 122 and 123:
and so we have got a very nice outc
- Page 124 and 125:
The development of communication, p
- Page 126 and 127:
The majority of Building User Repre
- Page 128 and 129:
are all the same, and the Percent f
- Page 130 and 131:
vandalism on WA Percent for Art bui
- Page 132 and 133:
The major benefits achieved by the
- Page 134 and 135:
Stakeholder groupDHW contract manag
- Page 136 and 137:
The Art Built-In Policy of the Quee
- Page 138 and 139:
cover the concept design. The commi
- Page 140 and 141:
artwork and project management. Acc
- Page 142 and 143:
Moreover, according to the Intervie
- Page 144 and 145:
Benefits of the Art Built-in policy
- Page 146 and 147:
Public art can enrich public cultur
- Page 148 and 149:
3 to discover skills that they had
- Page 150 and 151:
The artwork is able to increase pub
- Page 152 and 153:
Similar to the artwork’s ability
- Page 154 and 155:
potential. Also according to Client
- Page 156 and 157:
Multilayered artwork is able to be
- Page 158 and 159:
not be updated, as the artwork is a
- Page 160 and 161:
A number of benefits from the Art B
- Page 162 and 163:
administration and project manageme
- Page 164 and 165:
Those elements which were expected
- Page 166 and 167:
Globerman and Vining (1996) propose
- Page 168 and 169:
Table: WA Percent for Art policy an
- Page 170 and 171:
Summary of comparative analysisFigu
- Page 172 and 173:
concerning the art in buildings, th
- Page 174 and 175:
Appendix A: Summary of interviews f
- Page 176 and 177:
References“10% Training Policy”
- Page 178 and 179:
Hein, H. 1996. What is public art?:
- Page 180:
175