Multi Outcome Construction Policy (final report)
Multi Outcome Construction Policy (final report)
Multi Outcome Construction Policy (final report)
You also want an ePaper? Increase the reach of your titles
YUMPU automatically turns print PDFs into web optimized ePapers that Google loves.
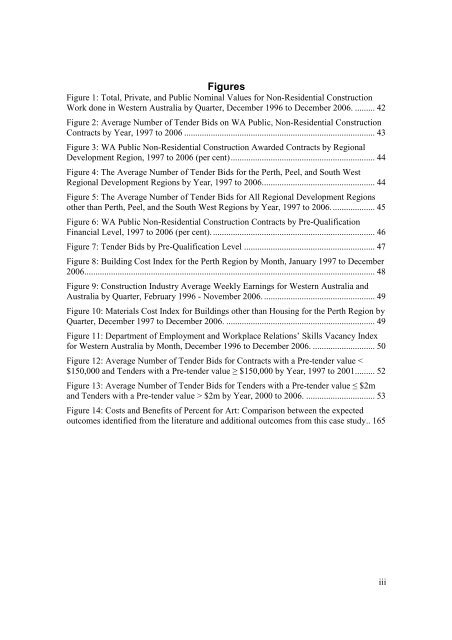
FiguresFigure 1: Total, Private, and Public Nominal Values for Non-Residential <strong>Construction</strong>Work done in Western Australia by Quarter, December 1996 to December 2006. ......... 42Figure 2: Average Number of Tender Bids on WA Public, Non-Residential <strong>Construction</strong>Contracts by Year, 1997 to 2006 ...................................................................................... 43Figure 3: WA Public Non-Residential <strong>Construction</strong> Awarded Contracts by RegionalDevelopment Region, 1997 to 2006 (per cent) ................................................................. 44Figure 4: The Average Number of Tender Bids for the Perth, Peel, and South WestRegional Development Regions by Year, 1997 to 2006. .................................................. 44Figure 5: The Average Number of Tender Bids for All Regional Development Regionsother than Perth, Peel, and the South West Regions by Year, 1997 to 2006. ................... 45Figure 6: WA Public Non-Residential <strong>Construction</strong> Contracts by Pre-QualificationFinancial Level, 1997 to 2006 (per cent). ......................................................................... 46Figure 7: Tender Bids by Pre-Qualification Level ........................................................... 47Figure 8: Building Cost Index for the Perth Region by Month, January 1997 to December2006. .................................................................................................................................. 48Figure 9: <strong>Construction</strong> Industry Average Weekly Earnings for Western Australia andAustralia by Quarter, February 1996 - November 2006. .................................................. 49Figure 10: Materials Cost Index for Buildings other than Housing for the Perth Region byQuarter, December 1997 to December 2006. ................................................................... 49Figure 11: Department of Employment and Workplace Relations’ Skills Vacancy Indexfor Western Australia by Month, December 1996 to December 2006. ............................ 50Figure 12: Average Number of Tender Bids for Contracts with a Pre-tender value $2m by Year, 2000 to 2006. ............................... 53Figure 14: Costs and Benefits of Percent for Art: Comparison between the expectedoutcomes identified from the literature and additional outcomes from this case study .. 165iii


