Multi Outcome Construction Policy (final report)
Multi Outcome Construction Policy (final report)
Multi Outcome Construction Policy (final report)

You also want an ePaper? Increase the reach of your titles
YUMPU automatically turns print PDFs into web optimized ePapers that Google loves.
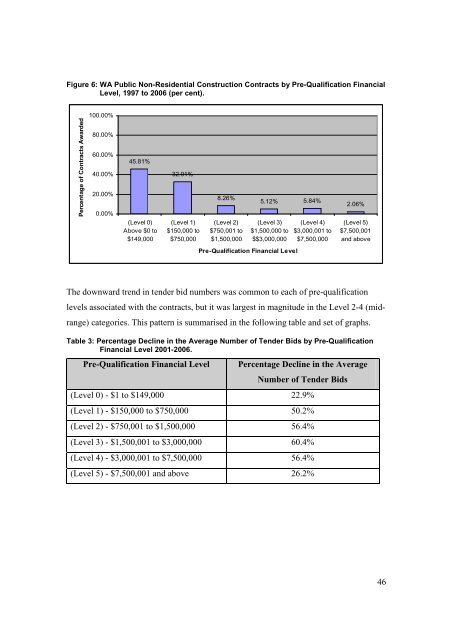
Figure 6: WA Public Non-Residential <strong>Construction</strong> Contracts by Pre-Qualification FinancialLevel, 1997 to 2006 (per cent).100.00%Percentage of Contracts Awarded80.00%60.00%40.00%20.00%0.00%45.81%(Level 0)Above $0 to$149,00032.91%(Level 1)$150,000 to$750,0008.26%(Level 2)$750,001 to$1,500,0005.12% 5.84%(Level 3)$1,500,000 to$$3,000,000(Level 4)$3,000,001 to$7,500,0002.06%(Level 5)$7,500,001and abovePre-Qualification Financial LevelThe downward trend in tender bid numbers was common to each of pre-qualificationlevels associated with the contracts, but it was largest in magnitude in the Level 2-4 (midrange)categories. This pattern is summarised in the following table and set of graphs.Table 3: Percentage Decline in the Average Number of Tender Bids by Pre-QualificationFinancial Level 2001-2006.Pre-Qualification Financial LevelPercentage Decline in the AverageNumber of Tender Bids(Level 0) - $1 to $149,000 22.9%(Level 1) - $150,000 to $750,000 50.2%(Level 2) - $750,001 to $1,500,000 56.4%(Level 3) - $1,500,001 to $3,000,000 60.4%(Level 4) - $3,000,001 to $7,500,000 56.4%(Level 5) - $7,500,001 and above 26.2%46