ENGINEERINGADVANTAGENOTES TO THE FINANCIAL STATEMENTS19. Employee benefitsPension arrangements, other post-employment and other long-term employee benefit arrangements are accounted for inaccordance with the requirements of IAS19. As at 31 December <strong>2012</strong> the Group continues to provide pension benefitsthrough a mixture of defined benefit and defined contribution arrangements. Contributions to defined contributionarrangements are recognised in the consolidated income statement as incurred.The major pension and other post-employment benefit arrangements are funded with plan assets that have been segregated ina trust or foundation. Assessments of the obligations for funded and unfunded plans are carried out by independent actuaries,based on the projected unit credit method. Pension costs primarily represent the increase in the actuarial present value of theobligation for projected benefits based on employee service during the year and the interest on this obligation in respect ofemployee service in previous years, net of the expected return on the assets. Movements in the pension assets and liabilitiesthat arise during the year from changes in actuarial assumptions, or because actual experience is different from the underlyingactuarial assumptions, are recognised through equity.The Group also provides a number of other long-term arrangements to our employees, with benefits payable more than12 months after the related services are rendered. These plans are generally not funded and actuarial gains and losses arerecognised in the income statement in the period in which they arise.The Group’s strategy is to move away from defined benefit arrangements towards defined contribution arrangements whereverpossible and to minimise the liability of the Group. The Group has 79 (2011: 75) different defined benefit arrangementsworldwide. The increase in the number of schemes during the year resulted from the acquisition activity.The largest defined benefit arrangement is the <strong>IMI</strong> Pension Fund in the UK (‘the Fund’). This constitutes 82% of the totaldefined benefit liabilities and 89% of the total defined benefit assets. The last formal triennial actuarial valuation of the Fundwas carried out as at 31 March 2011. The statement of funding principles agreed with the Trustee resulted in an actuarialdeficit of £120m. The Group agreed to pay a special contribution of £36.1m in December 2011 and further contributions of£16.8m each July from <strong>2012</strong> to 2016 inclusive as part of the recovery plan to close the deficit by 2016.The Fund was closed to future accrual on 31 December 2010. In 2010 the Trustee also purchased approximately £325m ofannuities to match certain benefit payments due from the Fund. The purchase price of these annuities was greater than thevalue, measured using the underlying IAS19 assumptions, of the insured benefits. The Trustee also rearranged the remainingFund assets with the objective of preserving the expected return on the total Fund assets (including the annuity policies).This was achieved, with a reduction in the funding volatility of the Fund, as measured by the Trustee’s value at risk model,of approximately 25%. The purchase of the annuities also reduced the mortality risk by around 20%.Also during 2010, the difference between the cost of the annuities and the underlying IAS19 liability was financed by a specialcontribution to the Fund of £48.6m which the Trustee agreed to invest in a special purpose vehicle giving them conditionalrights to receive income of £4.4m a year for twenty years, or until the Fund becomes fully funded, provided the Group paiddividends to its shareholders in the previous year. As at 31 December <strong>2012</strong>, the valuation of this asset for the purpose of itsinclusion in the Group’s net liability for defined benefit obligations under IAS19 was £27.1m.The Group recognises there is a risk inherent within defined benefit arrangements that the assets do not match the liabilities atany given point in time. In advance of the <strong>IMI</strong> Pension Fund 2011 triennial actuarial valuation, the Group continued to workwith the Trustee to mitigate the risk of a volatile funding position. A number of important initiatives were implemented in linewith this objective.During 2011 certain Fund members accepted the Group’s enhanced transfer value offer. The 31 December 2011 definedbenefit obligation in respect of the Fund reflected the liability to pay transfer values in early <strong>2012</strong>. The transfer values payablewere less than the value of the liabilities measured using the underlying IAS19 assumptions, which resulted in a curtailmentgain. As part of the Group’s offer, in addition to paying transfer values from the Fund (which reduced the IAS19 assets andliabilities by £27.4m each), in <strong>2012</strong>, the Group made payments of £8.5m to the individuals in addition to paying employers’national insurance thereon of £1.1m. The curtailment gain of £11.7m <strong>report</strong>ed for the year ended 31 December 2011 in thisnote was therefore partially offset by £9.6m additional pension costs accrued at this date, which resulted in a net gain of£2.1m, reflected in segmental operating profit.An exercise was also carried out whereby Fund pensioners were given the option, with effect from 1 January <strong>2012</strong>, toexchange future increases on their pensions for a higher current pension. This resulted in a reduction in the Fund’s IAS19defined benefit obligation of £9.0m as at 1 January <strong>2012</strong>, and is reflected as an exceptional past service credit in the incomestatement for <strong>2012</strong>.Also included in the exceptional net credit on special pensions events of £10.9m is a credit of £3.2m related to a change in thescheme rules of two of our Swiss plans and a charge of £1.3m relating to the exit from a state-sponsored scheme in Japan.116 Financial statements
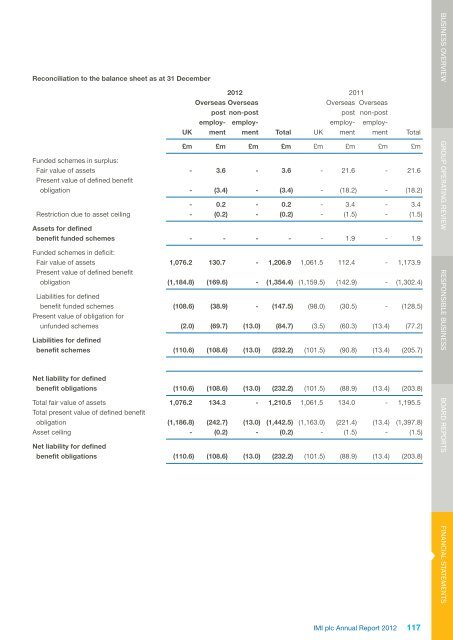
Reconciliation to the balance sheet as at 31 December<strong>2012</strong> 2011Overseas OverseasOverseas Overseaspost non-postpost non-postemploy- employ- employ- employ-UK ment ment Total UK ment ment Total£m £m £m £m £m £m £m £mFunded schemes in surplus:Fair value of assets - 3.6 - 3.6 - 21.6 - 21.6Present value of defined benefitobligation - (3.4) - (3.4) - (18.2) - (18.2)- 0.2 - 0.2 - 3.4 - 3.4Restriction due to asset ceiling - (0.2) - (0.2) - (1.5) - (1.5)Assets for definedbenefit funded schemes - - - - - 1.9 - 1.9Funded schemes in deficit:Fair value of assets 1,076.2 130.7 - 1,206.9 1,061.5 112.4 - 1,173.9Present value of defined benefitobligation (1,184.8) (169.6) - (1,354.4) (1,159.5) (142.9) - (1,302.4)Liabilities for definedbenefit funded schemes (108.6) (38.9) - (147.5) (98.0) (30.5) - (128.5)Present value of obligation forunfunded schemes (2.0) (69.7) (13.0) (84.7) (3.5) (60.3) (13.4) (77.2)Liabilities for definedbenefit schemes (110.6) (108.6) (13.0) (232.2) (101.5) (90.8) (13.4) (205.7)Net liability for definedbenefit obligations (110.6) (108.6) (13.0) (232.2) (101.5) (88.9) (13.4) (203.8)Total fair value of assets 1,076.2 134.3 - 1,210.5 1,061.5 134.0 - 1,195.5Total present value of defined benefitobligation (1,186.8) (242.7) (13.0) (1,442.5) (1,163.0) (221.4) (13.4) (1,397.8)Asset ceiling - (0.2) - (0.2) - (1.5) - (1.5)Net liability for definedbenefit obligations (110.6) (108.6) (13.0) (232.2) (101.5) (88.9) (13.4) (203.8)BUSINESS OVERVIEW GROUP OPERATING REVIEW RESPONSIBLE BUSINESS BOARD REPORTSFINANCIAL STATEMENTS<strong>IMI</strong> <strong>plc</strong> Annual Report <strong>2012</strong>117