- Page 1 and 2:
ENGINEERINGADVANTAGEIMI plc annual
- Page 3 and 4:
IMI is a global engineering group f
- Page 5 and 6:
RetailDispense22%FluidControls78%Fa
- Page 7:
UKWesternEuropeEmergingMarketsNorth
- Page 10 and 11:
ENGINEERINGADVANTAGELeadership in o
- Page 12 and 13:
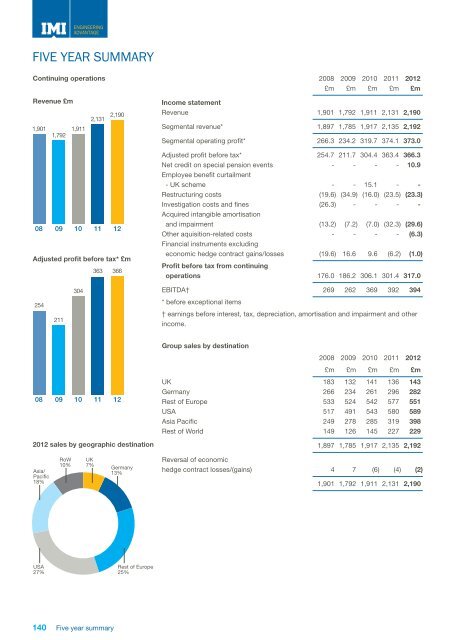
ENGINEERINGADVANTAGEOUR PERFORMANCE
- Page 14 and 15:
ENGINEERINGADVANTAGECHAIRMAN ANDCHI
- Page 16 and 17:
ENGINEERINGADVANTAGECHAIRMAN AND CH
- Page 18 and 19:
ENGINEERINGADVANTAGEFLUID CONTROLS
- Page 20 and 21:
ENGINEERINGADVANTAGEFLUID CONTROLS
- Page 22 and 23:
ENGINEERINGADVANTAGEFINANCIAL REVIE
- Page 24 and 25:
ENGINEERINGADVANTAGEFINANCIAL REVIE
- Page 26 and 27:
ENGINEERINGADVANTAGEFINANCIAL REVIE
- Page 28 and 29:
ENGINEERINGADVANTAGERESPONSIBLE BUS
- Page 30 and 31:
ENGINEERINGADVANTAGERESPONSIBLE BUS
- Page 32 and 33:
ENGINEERINGADVANTAGERESPONSIBLE BUS
- Page 34 and 35:
ENGINEERINGADVANTAGEPRINCIPAL RISKS
- Page 36 and 37:
ENGINEERINGADVANTAGEBOARD OF DIRECT
- Page 38 and 39:
ENGINEERINGADVANTAGEDirectors’ Re
- Page 40 and 41:
ENGINEERINGADVANTAGEDirectors’ Re
- Page 42 and 43:
ENGINEERINGADVANTAGEChairman’s go
- Page 44 and 45:
ENGINEERINGADVANTAGEthe Board’s c
- Page 46 and 47:
ENGINEERINGADVANTAGEthe Board’s c
- Page 48 and 49:
ENGINEERINGADVANTAGEthe Board’s c
- Page 50 and 51:
ENGINEERINGADVANTAGELetter from the
- Page 52 and 53:
ENGINEERINGADVANTAGERemuneration Re
- Page 54 and 55:
ENGINEERINGADVANTAGERemuneration Re
- Page 56 and 57:
ENGINEERINGADVANTAGERemuneration Re
- Page 58 and 59:
ENGINEERINGADVANTAGERemuneration Re
- Page 60 and 61:
ENGINEERINGADVANTAGERemuneration Re
- Page 62 and 63:
ENGINEERINGADVANTAGERemuneration Re
- Page 64 and 65:
ENGINEERINGADVANTAGERemuneration Re
- Page 66 and 67:
ENGINEERINGADVANTAGERemuneration Re
- Page 68 and 69:
ENGINEERINGADVANTAGERemuneration Re
- Page 70 and 71:
ENGINEERINGADVANTAGERemuneration Re
- Page 72 and 73:
ENGINEERINGADVANTAGEStatement of di
- Page 74 and 75:
ENGINEERINGADVANTAGECONSOLIDATED IN
- Page 76 and 77:
ENGINEERINGADVANTAGECONSOLIDATED ba
- Page 78 and 79:
ENGINEERINGADVANTAGEconsolidated st
- Page 80 and 81:
ENGINEERINGADVANTAGENotes to the Fi
- Page 82 and 83:
ENGINEERINGADVANTAGENotes to the Fi
- Page 84 and 85:
ENGINEERINGADVANTAGENotes to the Fi
- Page 86 and 87:
ENGINEERINGADVANTAGENotes to the Fi
- Page 88 and 89:
ENGINEERINGADVANTAGENotes to the Fi
- Page 90 and 91:
ENGINEERINGADVANTAGENotes to the Fi
- Page 92 and 93: ENGINEERINGADVANTAGENotes to the Fi
- Page 94 and 95: ENGINEERINGADVANTAGENotes to the Fi
- Page 96 and 97: ENGINEERINGADVANTAGENotes to the Fi
- Page 98 and 99: ENGINEERINGADVANTAGENotes to the Fi
- Page 100 and 101: ENGINEERINGADVANTAGENotes to the Fi
- Page 102 and 103: ENGINEERINGADVANTAGENotes to the Fi
- Page 104 and 105: ENGINEERINGADVANTAGENotes to the Fi
- Page 106 and 107: ENGINEERINGADVANTAGENotes to the Fi
- Page 108 and 109: ENGINEERINGADVANTAGENotes to the Fi
- Page 110 and 111: ENGINEERINGADVANTAGENOTES TO THE FI
- Page 112 and 113: ENGINEERINGADVANTAGENOTES TO THE FI
- Page 114 and 115: ENGINEERINGADVANTAGENOTES TO THE FI
- Page 116 and 117: ENGINEERINGADVANTAGENOTES TO THE FI
- Page 118 and 119: ENGINEERINGADVANTAGENOTES TO THE FI
- Page 120 and 121: ENGINEERINGADVANTAGENOTES TO THE FI
- Page 122 and 123: ENGINEERINGADVANTAGENOTES TO THE FI
- Page 124 and 125: ENGINEERINGADVANTAGENOTES TO THE FI
- Page 126 and 127: ENGINEERINGADVANTAGENOTES TO THE FI
- Page 128 and 129: ENGINEERINGADVANTAGENOTES TO THE FI
- Page 130 and 131: ENGINEERINGADVANTAGENOTES TO THE FI
- Page 132 and 133: ENGINEERINGADVANTAGENOTES TO THE FI
- Page 134 and 135: ENGINEERINGADVANTAGECOMPANY BALANCE
- Page 136 and 137: ENGINEERINGADVANTAGECOMPANY NOTES T
- Page 138 and 139: ENGINEERINGADVANTAGECOMPANY NOTES T
- Page 140 and 141: ENGINEERINGADVANTAGESUBSIDIARY UNDE
- Page 144 and 145: ENGINEERINGADVANTAGESHAREHOLDER INF
- Page 146 and 147: ENGINEERINGADVANTAGEINDEXAccounting
- Page 148: IMI plcLakesideSolihull ParkwayBirm