Huygens Professional User Guide
Huygens Professional User Guide
Huygens Professional User Guide

Create successful ePaper yourself
Turn your PDF publications into a flip-book with our unique Google optimized e-Paper software.
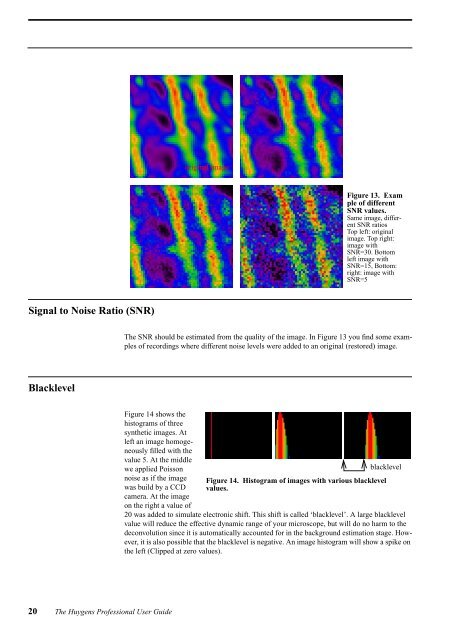
original imageFigure 13. Example of differentSNR values.Same image, differentSNR ratiosTop left: originalimage. Top right:image withSNR=30. Bottomleft image withSNR=15, Bottom:right: image withSNR=5Signal to Noise Ratio (SNR)The SNR should be estimated from the quality of the image. In Figure 13 you find some examplesof recordings where different noise levels were added to an original (restored) image.BlacklevelFigure 14 shows thehistograms of threesynthetic images. Atleft an image homogeneouslyfilled with thevalue 5. At the middlewe applied Poissonnoise as if the imagewas build by a CCDcamera. At the imageon the right a value ofblacklevelFigure 14. Histogram of images with various blacklevelvalues.20 was added to simulate electronic shift. This shift is called ‘blacklevel’. A large blacklevelvalue will reduce the effective dynamic range of your microscope, but will do no harm to thedeconvolution since it is automatically accounted for in the background estimation stage. However,it is also possible that the blacklevel is negative. An image histogram will show a spike onthe left (Clipped at zero values).20 The <strong>Huygens</strong> <strong>Professional</strong> <strong>User</strong> <strong>Guide</strong>