

20 - Year Growth Plan - City of Kendleton
20 - Year Growth Plan - City of Kendleton
20 - Year Growth Plan - City of Kendleton

Create successful ePaper yourself
Turn your PDF publications into a flip-book with our unique Google optimized e-Paper software.
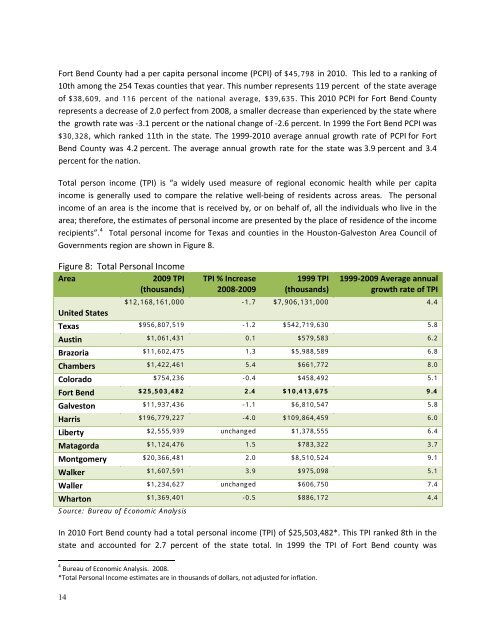
Fort Bend County had a per capita personal income (PCPI) <strong>of</strong> $45,798 in <strong>20</strong>10. This led to a ranking <strong>of</strong>10th among the 254 Texas counties that year. This number represents 119 percent <strong>of</strong> the state average<strong>of</strong> $38,609, and 116 percent <strong>of</strong> the national average, $39,635. This <strong>20</strong>10 PCPI for Fort Bend Countyrepresents a decrease <strong>of</strong> 2.0 perfect from <strong>20</strong>08, a smaller decrease than experienced by the state wherethe growth rate was ‐3.1 percent or the national change <strong>of</strong> ‐2.6 percent. In 1999 the Fort Bend PCPI was$30,328, which ranked 11th in the state. The 1999‐<strong>20</strong>10 average annual growth rate <strong>of</strong> PCPI for FortBend County was 4.2 percent. The average annual growth rate for the state was 3.9 percent and 3.4percent for the nation.Total person income (TPI) is “a widely used measure <strong>of</strong> regional economic health while per capitaincome is generally used to compare the relative well‐being <strong>of</strong> residents across areas. The personalincome <strong>of</strong> an area is the income that is received by, or on behalf <strong>of</strong>, all the individuals who live in thearea; therefore, the estimates <strong>of</strong> personal income are presented by the place <strong>of</strong> residence <strong>of</strong> the incomerecipients”. 4 Total personal income for Texas and counties in the Houston‐Galveston Area Council <strong>of</strong>Governments region are shown in Figure 8.Figure 8: Total Personal IncomeArea<strong>20</strong>09 TPI(thousands)United StatesTPI % Increase<strong>20</strong>08‐<strong>20</strong>091999 TPI(thousands)1999‐<strong>20</strong>09 Average annualgrowth rate <strong>of</strong> TPI$12,168,161,000 -1.7 $7,906,131,000 4.4Texas $956,807,519 -1.2 $542,719,630 5.8Austin $1,061,431 0.1 $579,583 6.2Brazoria $11,602,475 1.3 $5,988,589 6.8Chambers $1,422,461 5.4 $661,772 8.0Colorado $754,236 -0.4 $458,492 5.1Fort Bend $25,503,482 2.4 $10,413,675 9.4Galveston $11,937,436 -1.1 $6,810,547 5.8Harris $196,779,227 -4.0 $109,864,459 6.0Liberty $2,555,939 unchanged $1,378,555 6.4Matagorda $1,124,476 1.5 $783,322 3.7Montgomery $<strong>20</strong>,366,481 2.0 $8,510,524 9.1Walker $1,607,591 3.9 $975,098 5.1Waller $1,234,627 unchanged $606,750 7.4Wharton $1,369,401 -0.5 $886,172 4.4Source: Bureau <strong>of</strong> Economic AnalysisIn <strong>20</strong>10 Fort Bend county had a total personal income (TPI) <strong>of</strong> $25,503,482*. This TPI ranked 8th in thestate and accounted for 2.7 percent <strong>of</strong> the state total. In 1999 the TPI <strong>of</strong> Fort Bend county was4 Bureau <strong>of</strong> Economic Analysis. <strong>20</strong>08.*Total Personal Income estimates are in thousands <strong>of</strong> dollars, not adjusted for inflation.14