Age and ethnic restaurant visiting frequency - Theseus
Age and ethnic restaurant visiting frequency - Theseus
Age and ethnic restaurant visiting frequency - Theseus

You also want an ePaper? Increase the reach of your titles
YUMPU automatically turns print PDFs into web optimized ePapers that Google loves.
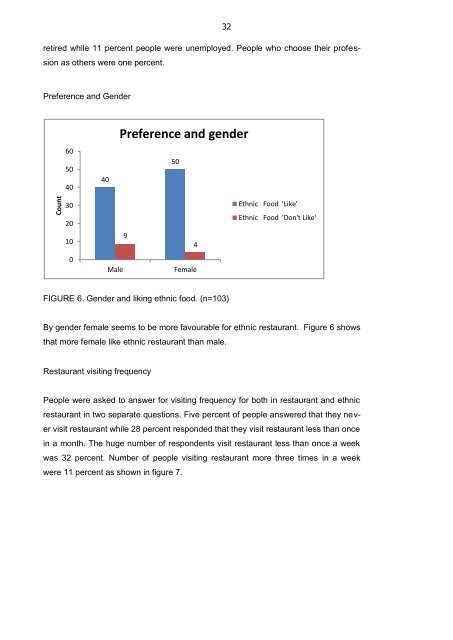
Countretired while 11 percent people were unemployed. People who choose their professionas others were one percent.32Preference <strong>and</strong> Gender60504040Preference <strong>and</strong> gender5030Ethnic Food 'Like'201094Ethnic Food 'Don't Like'0MaleFemaleFIGURE 6. Gender <strong>and</strong> liking <strong>ethnic</strong> food. (n=103)By gender female seems to be more favourable for <strong>ethnic</strong> <strong>restaurant</strong>. Figure 6 showsthat more female like <strong>ethnic</strong> <strong>restaurant</strong> than male.Restaurant <strong>visiting</strong> <strong>frequency</strong>People were asked to answer for <strong>visiting</strong> <strong>frequency</strong> for both in <strong>restaurant</strong> <strong>and</strong> <strong>ethnic</strong><strong>restaurant</strong> in two separate questions. Five percent of people answered that they nevervisit <strong>restaurant</strong> while 28 percent responded that they visit <strong>restaurant</strong> less than oncein a month. The huge number of respondents visit <strong>restaurant</strong> less than once a weekwas 32 percent. Number of people <strong>visiting</strong> <strong>restaurant</strong> more three times in a weekwere 11 percent as shown in figure 7.