Equity in School Water and Sanitation
Equity in School Water and Sanitation
Equity in School Water and Sanitation

You also want an ePaper? Increase the reach of your titles
YUMPU automatically turns print PDFs into web optimized ePapers that Google loves.
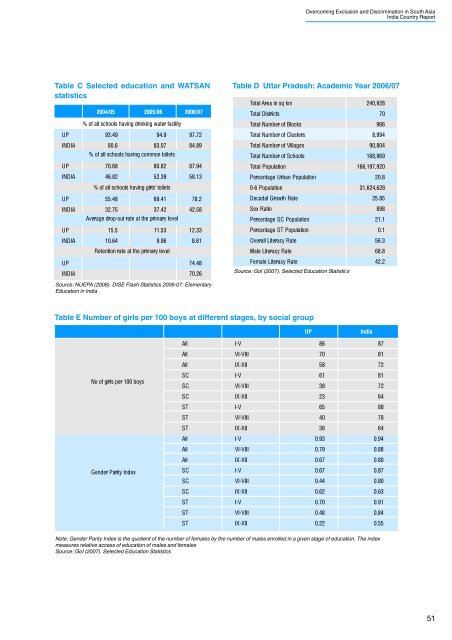
Overcom<strong>in</strong>g Exclusion <strong>and</strong> Discrim<strong>in</strong>ation <strong>in</strong> South AsiaIndia Country ReportTable C Selected education <strong>and</strong> WATSANstatisticsUPINDIAUPINDIAUPINDIAUPINDIAUPINDIA2004/0593.492005/06% of all schools hav<strong>in</strong>g dr<strong>in</strong>k<strong>in</strong>g water facility94.980.683.07% of all schools hav<strong>in</strong>g common toilets70.6846.8280.8252.39% of all schools hav<strong>in</strong>g girls' toilets55.4869.4132.7537.42Average drop-out rate at the primary level15.510.6411.539.96Retention rate at the primary level2006/0797.7284.8987.9458.1378.242.5812.338.6174.4870.26Table D Uttar Pradesh: Academic Year 2006/07Total Area <strong>in</strong> sq km240,928Total Districts70Total Number of Blocks966Total Number of Clusters8,994Total Number of Villages90,804Total Number of <strong>School</strong>s168,969Total Population166,197,920Percentage Urban Population20.80-6 Population31,624,628Decadal Growth Rate25.85Sex Ratio898Percentage SC Population21.1Percentage ST Population0.1Overall Literacy Rate56.3Male Literacy Rate68.8Female Literacy Rate42.2Source: GoI (2007). Selected Education StatisticsSource: NUEPA (2008). DISE Flash Statistics 2006-07: ElementaryEducation <strong>in</strong> IndiaTable E Number of girls per 100 boys at different stages, by social groupUPIndiaAllI-V8687AllVI-VIII7081AllIX-XII5872No of girls per 100 boysSCSCI-VVI-VIII61388172SCIX-XII2364STI-V6588STVI-VIII4078STIX-XII3664AllI-V0.930.94AllVI-VIII0.790.88AllIX-XII0.670.80Gender Parity IndexSCI-V0.670.87SCVI-VIII0.440.80SCIX-XII0.620.63STI-V0.700.91STVI-VIII0.480.84STIX-XII0.220.55Note: Gender Parity Index is the quotient of the number of females by the number of males enrolled <strong>in</strong> a given stage of education. The <strong>in</strong>dexmeasures relative access of education of males <strong>and</strong> femalesSource: GoI (2007). Selected Education Statistics51