Equity in School Water and Sanitation
Equity in School Water and Sanitation
Equity in School Water and Sanitation

Create successful ePaper yourself
Turn your PDF publications into a flip-book with our unique Google optimized e-Paper software.
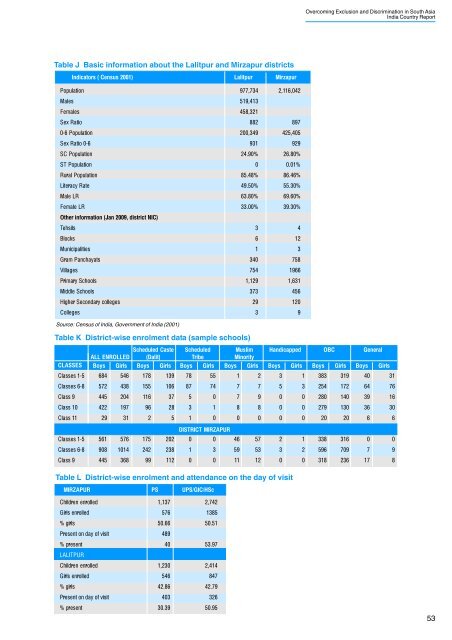
Overcom<strong>in</strong>g Exclusion <strong>and</strong> Discrim<strong>in</strong>ation <strong>in</strong> South AsiaIndia Country ReportTable J Basic <strong>in</strong>formation about the Lalitpur <strong>and</strong> Mirzapur districtsIndicators ( Census 2001)PopulationMalesFemalesSex Ratio0-6 PopulationSex Ratio 0-6SC PopulationST PopulationRural PopulationLiteracy RateMale LRFemale LROther <strong>in</strong>formation (Jan 2009, district NIC)TehsilsBlocksMunicipalitiesGram PanchayatsVillagesPrimary <strong>School</strong>sMiddle <strong>School</strong>sHigher Secondary collegesCollegesSource: Census of India, Government of India (2001)Lalitpur977,734519,413458,321882200,34993124.90%085.48%49.50%63.80%33.00%3613407541,129373293Mirzapur2,116,042897425,40592926.80%0.01%86.46%55.30%69.60%39.30%412375819661,6314561209Table K District-wise enrolment data (sample schools)CLASSESClasses 1-5Scheduled Caste Scheduled Muslim H<strong>and</strong>icapped OBC GeneralALL ENROLLED (Dalit)TribeM<strong>in</strong>orityBoys Girls Boys Girls Boys Girls Boys Girls Boys Girls Boys Girls Boys Girls684546178139785512313833194031Classes 6-8572438155106877477532541726476Class 9445204116375079002801403916Class 1042219796283188002791303630Class 11293125100000202066DISTRICT MIRZAPURClasses 1-55615761752020046572133831600Classes 6-890810142422381359533259670979Class 94453689911200111200318236178Table L District-wise enrolment <strong>and</strong> attendance on the day of visitMIRZAPURPSUPS/GIC/HScChildren enrolled1,1372,742Girls enrolled5761385% girls50.6650.51Present on day of visit489% present4053.97LALITPURChildren enrolled1,2302,414Girls enrolled546847% girls42.8642.79Present on day of visit403326% present30.3950.9553