Equity in School Water and Sanitation
Equity in School Water and Sanitation
Equity in School Water and Sanitation

You also want an ePaper? Increase the reach of your titles
YUMPU automatically turns print PDFs into web optimized ePapers that Google loves.
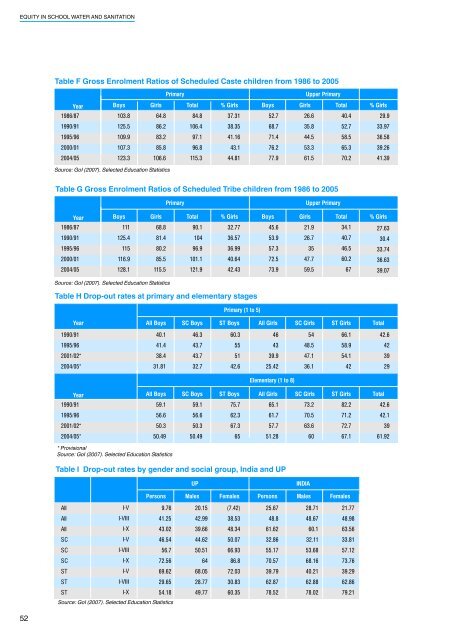
EQUITY IN SCHOOL WATER AND SANITATIONTable F Gross Enrolment Ratios of Scheduled Caste children from 1986 to 2005PrimaryUpper PrimaryYear Boys Girls Total % Girls Boys Girls Total % Girls1986/871990/911995/962000/012004/05103.8125.5109.9107.3123.364.886.283.285.8106.684.8106.497.196.8115.337.3138.3541.1643.144.8152.768.771.476.277.926.635.844.553.361.540.452.758.565.370.229.933.9736.5839.2641.39Source: GoI (2007). Selected Education StatisticsTable G Gross Enrolment Ratios of Scheduled Tribe children from 1986 to 2005PrimaryUpper PrimaryYear Boys Girls Total % Girls Boys Girls Total % Girls1986/87111 68.8 90.1 32.7745.6 21.9 34.1 27.631990/91125.4 81.4104 36.5753.9 26.7 40.730.41995/96115 80.2 96.9 36.9957.335 46.5 33.742000/01116.9 85.5 101.1 40.6472.5 47.7 60.2 36.632004/05128.1 115.5 121.9 42.4373.9 59.567 39.07Source: GoI (2007). Selected Education StatisticsTable H Drop-out rates at primary <strong>and</strong> elementary stagesPrimary (1 to 5)Year All Boys SC Boys ST Boys All Girls SC Girls ST Girls Total1990/9140.146.360.3465466.142.61995/9641.443.7554348.558.9422001/02*38.443.75139.947.154.1392004/05*31.8132.742.625.4236.14229Elementary (1 to 8)1990/911995/962001/02*2004/05*Year All Boys SC Boys ST Boys All Girls SC Girls ST Girls Total59.156.650.350.49* ProvisionalSource: GoI (2007). Selected Education StatisticsTable I Drop-out rates by gender <strong>and</strong> social group, India <strong>and</strong> UP59.156.650.350.4975.762.367.36565.161.757.751.2873.270.563.66082.271.272.767.142.642.13961.92UPPersons Males FemalesAllAllAllSCSCSCSTSTSTI-VI-VIIII-XI-VI-VIIII-XI-VI-VIIII-X9.7641.2543.0246.5456.772.5669.6229.6554.1820.1542.9939.6644.6250.516468.0528.7749.77(7.42)38.5348.3450.0766.9386.872.0330.8360.35Source: GoI (2007). Selected Education StatisticsINDIAPersons Males Females25.6748.861.6232.8655.1770.5739.7962.8778.5228.7148.6760.132.1153.6868.1640.2162.8878.0221.7748.9863.5633.8157.1273.7639.2962.8679.2152