Differential treatment in the youth justice system - Equality and ...
Differential treatment in the youth justice system - Equality and ...
Differential treatment in the youth justice system - Equality and ...

Create successful ePaper yourself
Turn your PDF publications into a flip-book with our unique Google optimized e-Paper software.
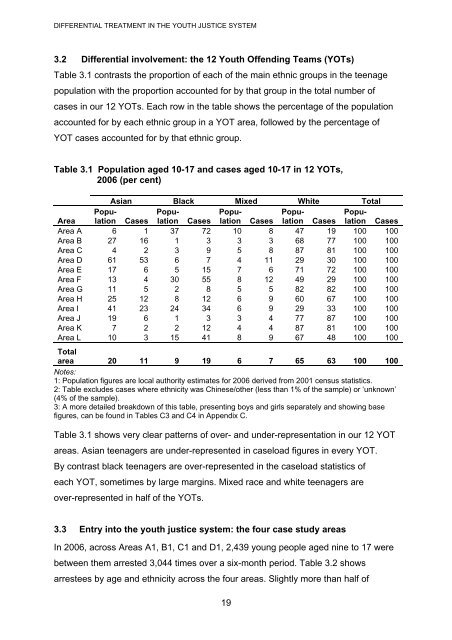
DIFFERENTIAL TREATMENT IN THE YOUTH JUSTICE SYSTEM3.2 <strong>Differential</strong> <strong>in</strong>volvement: <strong>the</strong> 12 Youth Offend<strong>in</strong>g Teams (YOTs)Table 3.1 contrasts <strong>the</strong> proportion of each of <strong>the</strong> ma<strong>in</strong> ethnic groups <strong>in</strong> <strong>the</strong> teenagepopulation with <strong>the</strong> proportion accounted for by that group <strong>in</strong> <strong>the</strong> total number ofcases <strong>in</strong> our 12 YOTs. Each row <strong>in</strong> <strong>the</strong> table shows <strong>the</strong> percentage of <strong>the</strong> populationaccounted for by each ethnic group <strong>in</strong> a YOT area, followed by <strong>the</strong> percentage ofYOT cases accounted for by that ethnic group.Table 3.1 Population aged 10-17 <strong>and</strong> cases aged 10-17 <strong>in</strong> 12 YOTs,2006 (per cent)Asian Black Mixed White TotalPopulationPopu-Popu-Popu-Popu-AreaCases lation Cases lation Cases lation Cases lation CasesArea A 6 1 37 72 10 8 47 19 100 100Area B 27 16 1 3 3 3 68 77 100 100Area C 4 2 3 9 5 8 87 81 100 100Area D 61 53 6 7 4 11 29 30 100 100Area E 17 6 5 15 7 6 71 72 100 100Area F 13 4 30 55 8 12 49 29 100 100Area G 11 5 2 8 5 5 82 82 100 100Area H 25 12 8 12 6 9 60 67 100 100Area I 41 23 24 34 6 9 29 33 100 100Area J 19 6 1 3 3 4 77 87 100 100Area K 7 2 2 12 4 4 87 81 100 100Area L 10 3 15 41 8 9 67 48 100 100Totalarea 20 11 9 19 6 7 65 63 100 100Notes:1: Population figures are local authority estimates for 2006 derived from 2001 census statistics.2: Table excludes cases where ethnicity was Ch<strong>in</strong>ese/o<strong>the</strong>r (less than 1% of <strong>the</strong> sample) or ‘unknown’(4% of <strong>the</strong> sample).3: A more detailed breakdown of this table, present<strong>in</strong>g boys <strong>and</strong> girls separately <strong>and</strong> show<strong>in</strong>g basefigures, can be found <strong>in</strong> Tables C3 <strong>and</strong> C4 <strong>in</strong> Appendix C.Table 3.1 shows very clear patterns of over- <strong>and</strong> under-representation <strong>in</strong> our 12 YOTareas. Asian teenagers are under-represented <strong>in</strong> caseload figures <strong>in</strong> every YOT.By contrast black teenagers are over-represented <strong>in</strong> <strong>the</strong> caseload statistics ofeach YOT, sometimes by large marg<strong>in</strong>s. Mixed race <strong>and</strong> white teenagers areover-represented <strong>in</strong> half of <strong>the</strong> YOTs.3.3 Entry <strong>in</strong>to <strong>the</strong> <strong>youth</strong> <strong>justice</strong> <strong>system</strong>: <strong>the</strong> four case study areasIn 2006, across Areas A1, B1, C1 <strong>and</strong> D1, 2,439 young people aged n<strong>in</strong>e to 17 werebetween <strong>the</strong>m arrested 3,044 times over a six-month period. Table 3.2 showsarrestees by age <strong>and</strong> ethnicity across <strong>the</strong> four areas. Slightly more than half of19