TABLE B-9.—Gross national product by sector, 1929-76[Billions of dollars, except as noted; quarterly data at seasonally adjusted annual rates]Year or quarterGrossnationalproductTotalTotalGross domestic productBusinessNonfarmxFarmTotalGovernment 2StatisticaldiscrepancyHouseholdsandinstitutionsFederalStateandlocalRestof theworldPercentchangefromprecedingperiod,grossdomesticproducts192919331939. .19401941194219431944.194519461947194819491950..1951....1952195319541955195619571958 . ...1959I96019611962 . .196319641965 . .196619671968196919701971 . .19721973197419751976 v1974: 1IIIIIIV1975: 1IIIIIIV1976: 1IIIIIIV V103.455.890.8100.0124.9158.3192.0210.5212.3209.6232 8259.1258.0286.2330.2347 2366.13b6.3399 3420.7442.8448.9486.5506.0523.3563.8594.7635.7688.1753.0796.3868.5935.5982.41, 063.41 171 11,306.61,413.21,516.31, 692.41,372.71,399.41,431.61, 449.21, 446.21,482.31, 548.71,588.21,636.21,675.21,709.81, 748. 5102.655.590.599.6124.5157.9191.6210.1212.0209.0231.8257.9256.9284.8328.7345.7364.6364.5397.3418.5440.5446.6484.0503.5520.2560.2591.1631.4683.4748.8791.8863.7931.1977.81,056.81,164.11,297.51,398.71, 505.71, 679.11, 355.51,387.01,417.81,434.41,436.71,471.71, 537.41,577.11,623.21,662.81,696.11,734.395.449.180.689.4112.6139.9162.8174.2172.8183.8210.0234.9231.5257.5294.4307 3324.9323.9354 0372.1390.8393.1427.7442.5455 3490.4516.5550.7596.6651 1682.7742 2798.1831.58%. 9989 51,108.01,192 41,277.51,428.41,156.11,183.81,209.61,219.91,216.31,246.41,306.81,340.41,380.71,415.51,443.11, 474.284.743.872.981.8103.1127.7149.3156.2152.7164.2188 0212.7211.7235.5267.4282 5301.2301.3332 8354.3372.3370.7408.9423.0433 4465.9492.2529.2573.8625 0658.8720 2776.2807.6867.9955 81,055.31 137.31, 222.81,370.01,100.61,130.11,155.11,163.41,167.41,197.41, 246. 71,279.61,324.81, 354.71,384.49.74.66.36.58.913.015.315.316.018.920.223.318.820.022.922.220.319.618.818.618.420.719.120.220.220.520.519.322.022.922.222.625.225.927.732 050.148.550.350.853.146.646.947.242.549.055.054.848.755.050.049 41.1.71.41.1.5-.8-1.82.74.1.71.8-1.21.02.04.02.73.33.02.5-.8.21.7-.2-.71.64.03.72.2.93.21.7-.6-3.3-2.11.31 72.66.64.47.6? 47.17.79.36.4.15.16.17.25.88.72.91.72.32.42.52.93.23.74.14.55.15.65.96.46.97.27.88.19 19.810.511.412.313.8 47.114.4 50.515.5 54.316.6 58.017.8 62.919.2 67.621 1 76.523.9 85.126 4 95.229.2 103.731.634.737 240.544.749.755.942.744.045.746.448.149.050.451.553.354.857.058.64.34.77.67.89.415.125.632.235.220.816.717.419.420.927.431.231.932.534.236.639.142.144.0114.7125.2137 4149.1161.6178.5194.8156.7159.2162.5168.1172.4176.3180.1185.2189.2192.5196.0201.40.91.23.43.55.010.620.927.229.814.69.48.910.010.716.218 918.617.818.419.019.620.520.921.722.624.125.227.028.332.435.639.341.844.746.850 151.954.959.363.453.754.054.657.458.258.459.161.562.262.563.265.63.53.54.24.34.44.54.74.95.46.27.38.59.410.111.212.313.314.715.817.619.621.623.125.527.930.232.935.939.344.149.555.961.970.078.587 397.1106.7119.2131.4102.9105.2107.9110.7114.2117.9121.1123.7127.0130.0132.8135.80.8.3.3.4.4.4.3.4.3.5.91.21.11.31.51 51.51.82.02.22.32.22.42.53.13.63.74.34.74.24.64.84.54.66.67.09.114.510.613.317.212.413.814.89.410.611.311.113.012.413.714.2-4.17.010.125.026.821.49.6.9-1.410 911.3-.410.915.45 25.5-.09 05.35.21.48.44.03 37.75.56.88.29 65.79.17.85.08.110.111.57.87.711.53.19.69.24.8.710.119.110.812.210.18.29.31 Includes compensation of employees in government enterprises.2 Compensation of government employees.3 Changes are based on unrounded data and therefore may differ slightly from those obtained from data shown here.See table B-l for percent changes in gross national product.Source: Department of Commerce, Bureau of Economic Analysis.198
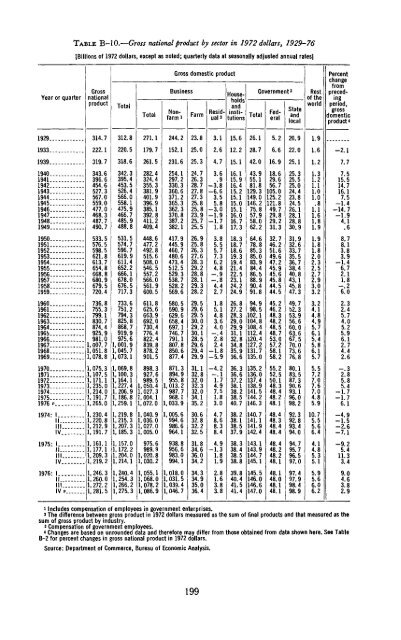
TABLE B-10.—Gross national product by sector in 1972 dollars, 1929-76[Billions of 1972 dollars, except as noted; quarterly data at seasonally adjusted annual rates]Year or quarterGrossnationalproductTotalTotalGross domestic productBusinessNonfarm*FarmResidual2TotalGovernmentsHouseholdsandinstitutionsFederalStateandlocalRestof theworldPercentchangefromprecedingperiod,grossdomesticproduct*1929314.7312.8271.1244.223.83.115.626.15.220.91.91933222.1220.5179.7152.125.02.612.228.76.622.01.6-2.119391940...19411942194319441945 .1946194719481949 .1950195119521953195419551956195719581959319.7343.6396.6454.6527.3567.0559.0477.0468.3487.7490.7533.5576.5598.5621.8613.7654.8668.8680.9679.5720.4318.6342.3395.4453.5526.4566.0558.1475.9466.7485.9488.8531.5574.7596.7619.9611.4652.2666.1678.0676.5717.3261.5282.4324.4355.3381.9401.9396.9385.1392.8411.2409.4448.6477.2492.8515.6508.0546.5557.2566.0561.9600.5231.6254.1297.2330.3360.6371.2365.3362.3370.8387.2382.1417.9445.9460.7480.6473.4512.5529.3538.7528.2569.625.324.726.328.727.827.325.825.823.925.725.526.925.826.327.628.329.228.828.129.328.24.73.6.9-3.8-6.63.55.8-3.0-1.9-1.71.83.85.55.77.36.24.8-.9-.84.42.715.116.115.916.415.215.115.015.116.016 717.318.318.718.619.319.421.422.523.124.224.942.043.955.181.8129.3149.0146.275.857.958.062.264.678.885.385.083.984.486.588.990.491.816.918.629.656.7105.0125.2121.849.729.829.231.332.746.251.649.647.245.945.645.844.544.525.125.325.525.024.423.824.526 128.128 830.931 932.633 735.536.738.440.843.145.847.31.21.31.21.11.01.0.81.11.61 81.91.91.81.82.02.32.52.72.93.03.27.77.515.514.716.17.5-1.4-14.7-1.94 1.68.78.13.83.9-1.46.72.11.8-.26.0196019611962196319641965196619671968196919701971197219731974 . .19751976 ^1974' 1IIIllIV1975- 1II . .IIIIV1976: 1IIIIIIV v736.8755.3799.1830.7874.4925.9981.01, 007. 71,051.81, 078.81,075.31,107.51,171.11,235.01,214.01,191.71,265.01,230.41, 220.81,212.91,191.71,161.11,177.11,209.31,219.21,246.31,260.01,272.21,281.5733.6751.2794.3825.8868.7919.9975.61,001.91,045.71, 073.11,069.81,100.31,164.11,227.41,206.91,186.81, 259.11,219.81,215.31, 207.31,185.31,157.01,172.21,204.01, 214.11,240.41,254.31, 266.21,275.3611.8625.6663.9692.0730.4776 4822.4839.8878.2901.5898.3927.6989.51,050.41,027.31, 004.11,072.01,040.91,036.01, 027.01, 005.0975.6989.91,020.81,030.21,055.11,068.01,078.21,086.9580.5590.9629.6658.4697.1746.7791.1807.8850.6877.4871.3894.9955.81,013.2987.7968.11, 033.91,005.6994.6986.6964.1938.8956.6983.0994.11,018.01,031.51,039.41,046.729.529.629.530.029.230.128.529.629.429.931.132.832.032.332.034.135.230.632.832.232.531.834.636.034.234.334.935.036.41.85.14.83.64.0-.42.82.4-1.8-5.9-4.2-.11.74.97.51.83.04.78.68.38.44.9-1.31.81.92.81.63.83.826.827.228.329.029.931.132.834.835.936.636.336.637.238.138.238.540.738.238.138.537.938.338.438.538.839.840.441.541.494.998.5102.1104.8108.4112.4120.4127.2131.7135.0135.2136.0137.4138.9141.5144.2146.3140.7141.1141.9142.4143.1143.9144.7145.1145.5146.0146.6147.045.246.248.348.248.548.753.057.258.158.255.252.550.148.348.448.248.148.448.348.448.448.448.248.248.148.148.048.148.149.752.353.956 660.063 667 570.073 676.880.183.587.390.693.196.098.292.392.893.494.094 795.796.597.097.497.998.498.93.24.14.84.95.76.15.45.86.15.75.57.27.07.67.04.85.910.75.55.66.44.14.85.35.15.95.66.06.22.32.45.74.05.25.96.12.74.42.6-.32.85.85.4-1.7-1.76.1-4.9-1.5-2.6-7.1-9.25.411.33.49.04.63.82.91 Includes compensation of employees in government enterprises.2 The difference between gross product in 1972 dollars measured as the sum of final products and that measured as thesum of gross product by industry.3 Compensation of government employees.* Changes are based on unrounded data and therefore may differ from those obtained from data shown here. See TableB-2 for percent changes in gross national product in 1972 dollars.Source: Department of Commerce, Bureau of Economic Analysis.199
- Page 1:
ECONOMICTRANSMITTEDTO THE CONGRESSJ
- Page 5:
CONTENTSPageECONOMIC REPORT OF THE
- Page 9 and 10:
ECONOMIC REPORT OF THE PRESIDENTTo
- Page 11 and 12:
manent tax rate reductions. My prop
- Page 13 and 14:
will help shield us from disruption
- Page 15 and 16:
executive branch must undertake a c
- Page 17:
lasting implications of the changes
- Page 21:
THE PRESIDENT:LETTER OF TRANSMITTAL
- Page 24 and 25:
CHAPTER 2. ECONOMIC REVIEW OF 1976
- Page 26 and 27:
List of Tables and Charts—Continu
- Page 29 and 30:
CHAPTER 1Economic Policy and Outloo
- Page 31 and 32:
GENERAL POLICY PRINCIPLESTo assure
- Page 33 and 34:
3. Economic initiatives should be b
- Page 35 and 36:
TABLE 1.—The market value and the
- Page 37 and 38:
on investment would increase with i
- Page 39 and 40:
MONETARY POLICYThe Federal Reserve
- Page 41 and 42:
like the latter part of 1976. The 4
- Page 43 and 44:
PRIVATE CONSUMPTIONThe growth of re
- Page 45 and 46:
NET EXPORTSIn real terms net export
- Page 47 and 48:
LABOR FORGE AND UNEMPLOYMENTIt is e
- Page 49 and 50:
led to large first-year catchup inc
- Page 51 and 52:
Consumer prices of fuels during 197
- Page 53 and 54:
other workers. Productivity is meas
- Page 55 and 56:
Since the mid-1950s a dramatic chan
- Page 57 and 58:
women's labor force participation;
- Page 59 and 60:
The full-employment benchmark has b
- Page 61 and 62:
Chart 4Gross National Product, Actu
- Page 63 and 64:
groups can be a useful supplement t
- Page 65 and 66:
TABLE 7.—Changes in gross nationa
- Page 67 and 68:
Relative price movements were appar
- Page 69 and 70:
August was followed by a 20 percent
- Page 71 and 72:
main price indexes were significant
- Page 73 and 74:
A broader measure of labor costs, c
- Page 75 and 76:
TABLE 13.—Output, profits, net in
- Page 77 and 78:
TABLE 15.—Federal Government rece
- Page 79 and 80:
In the unified budget the total sho
- Page 81 and 82:
The permanent changes in the Tax Re
- Page 83 and 84:
tial output and the full-employment
- Page 85 and 86:
For this reason, although the rate
- Page 87 and 88:
quarter a year later. The actual gr
- Page 89 and 90:
Partly as a result of the desire of
- Page 91 and 92:
widespread among demographic groups
- Page 93 and 94:
of longer-term trends. Over the pas
- Page 95 and 96:
ment and earnings show little cycli
- Page 97 and 98:
production or real GNP, and this al
- Page 99 and 100:
percent from 1973. The cost of petr
- Page 101 and 102:
COMMODITY MARKETS AND FOOD PRICESWo
- Page 103 and 104:
TABLE 25.—Real income per farm an
- Page 105 and 106:
While circumstances have enabled a
- Page 107 and 108:
The policy actions taken in 1975 an
- Page 109 and 110:
TABLE 27.—Changes in industrial p
- Page 111 and 112:
States some underspending by public
- Page 113 and 114:
continued strong domestically gener
- Page 115 and 116:
GENERAL DEMAND TRENDSEconomic devel
- Page 117 and 118:
PUBLIC SECTOR DEFICITSThe economic
- Page 119 and 120:
insurance funds. The requirement th
- Page 121 and 122:
TABLE 29.—Export shares in trade
- Page 123 and 124:
Chart 7—ContinuedINDEX, 1973=100
- Page 125 and 126:
widened and the possibility of borr
- Page 127 and 128:
Chart 8—ContinuedInterest Rates i
- Page 129 and 130:
Where stabilization policies are pe
- Page 131 and 132:
Germany grew more in line with outp
- Page 133 and 134:
TABLE 32.—Estimated disposition o
- Page 135 and 136:
ates, and tax changes that facilita
- Page 137 and 138:
facility is designed to help countr
- Page 139 and 140:
is necessary that the strongest eco
- Page 141 and 142:
A freezing of relative prices, eith
- Page 143 and 144:
implicit and explicit subsidies bui
- Page 145 and 146:
qualitative conclusions. For exampl
- Page 147 and 148:
For some youths unemployment is inv
- Page 149 and 150:
may be as low as 10 percent. Thus t
- Page 151 and 152:
large subsidies through the tax cre
- Page 153 and 154: in the transportation and public ut
- Page 155 and 156: trust exemption permits motor carri
- Page 157 and 158: purchase less expensive air travel.
- Page 159 and 160: produced with higher-cost energy so
- Page 161 and 162: of establishing efficient methods o
- Page 163 and 164: in the future. Consequently current
- Page 165 and 166: demand and supply at support prices
- Page 167 and 168: with stringent controls on peanut a
- Page 169 and 170: aspects of the tax system which imp
- Page 171 and 172: TABLE 35—Change in aUer-tax inter
- Page 173 and 174: and raise the return to capital inc
- Page 175: come, social security encourages pe
- Page 179: LETTER OF TRANSMITTALCOUNCIL OF ECO
- Page 182 and 183: RESPONSIBILITIES OF THE COUNCILThe
- Page 184 and 185: the Administration's economic polic
- Page 186 and 187: member of the senior staff, and Rob
- Page 189 and 190: CONTENTSNATIONAL INCOME OR EXPENDIT
- Page 191: PageB-76. Estimated ownership of pu
- Page 194 and 195: TABLE B-2.—Gross national product
- Page 196 and 197: TABLE B-3.—Implicit price deflato
- Page 198 and 199: TABLE B-4.—Implicit price deflato
- Page 200 and 201: TABLE B~6.—Gross national product
- Page 202 and 203: TABLE B-8.—Gross national product
- Page 206 and 207: TABLE B-ll.—Gross domestic produc
- Page 208 and 209: TABLE B-13.—Personal consumption
- Page 210 and 211: TABLE B-15.—Inventories and final
- Page 212 and 213: TABLE B-17.—Relation of gross nat
- Page 214 and 215: TABLE B-19.—National income by ty
- Page 216 and 217: TABLE B-20.—Sources of personal i
- Page 218 and 219: TABLE B-21.—Disposition of person
- Page 220 and 221: 19291933Year orquarter1939...194019
- Page 222 and 223: TABLE B~25.- -Number and money inco
- Page 224 and 225: TABLE B-27.—Noninstitutional popu
- Page 226 and 227: TABLE B-28.—Civilian employment a
- Page 228 and 229: TABLE B-30.— Unemployment by dura
- Page 230 and 231: TABLE B-32.—Wage and salary worke
- Page 232 and 233: TABLE B-33.—Average weekly hours
- Page 234 and 235: TABLE B-35.—Productivity and rela
- Page 236 and 237: PRODUCTION AND BUSINESS ACTIVITYTAB
- Page 238 and 239: TABLE B-39.—Industrial production
- Page 240 and 241: TABLE B-41.—New construction acti
- Page 242 and 243: TABLE B-42.—New housing units sta
- Page 244 and 245: TABLE B-44.—Sales and inventories
- Page 246 and 247: TABLE B-46.'—Manufacturers 1 new
- Page 248 and 249: TABLE B-48.—Consumer price indexe
- Page 250 and 251: TABLE B—50.—Consumer price inde
- Page 252 and 253: TABLE B-52.—Percent changes in co
- Page 254 and 255:
19291933193919401941194219431944194
- Page 256 and 257:
TABLE B-54.—Wholesale price index
- Page 258 and 259:
TABLE B-56.—Percent changes in wh
- Page 260 and 261:
TABLE B-58.—Commercial bank loans
- Page 262 and 263:
TABLE B-60.—Total funds raised in
- Page 264 and 265:
TABLE B-61.—Federal Reserve Bank
- Page 266 and 267:
TABLE B-63.—Bond yields and inter
- Page 268 and 269:
TABLE B-64,—Instalment credit ext
- Page 270 and 271:
TABLE B-66.— Mortgage debt outsta
- Page 272 and 273:
GOVERNMENT FINANCETABLE B-68.—Fed
- Page 274 and 275:
TABLE B-69.—Federal budget receip
- Page 276 and 277:
TABLE B-71.—Receipts and expendit
- Page 278 and 279:
TABLE B-73.—Receipts and expendit
- Page 280 and 281:
TABLE B-75.—Interest-bearing publ
- Page 282 and 283:
TABLE B-77.—Average length and ma
- Page 284 and 285:
TABLE B-79.—Corporate profits by
- Page 286 and 287:
TABLE B—80.—-Corporate profits
- Page 288 and 289:
TABLE B1-81.—Sales, profits, and
- Page 290 and 291:
TABLE B-83.—Relation of profits a
- Page 292 and 293:
TABLE B-85.—Current assets and li
- Page 294 and 295:
TABLE B-87.—Common stock prices a
- Page 296 and 297:
192919331939Year orquarter19401941
- Page 298 and 299:
TABLE B-91.—Farm population, empl
- Page 300 and 301:
TABLI. B-93.—Selected measures of
- Page 302 and 303:
INTERNATIONAL STATISTICSTABLE B-95.
- Page 304 and 305:
TABLE B-96.—U.S. merchandise expo
- Page 306 and 307:
TABLE B-98.—U.S. overseas loans a
- Page 308 and 309:
TABLE B-100.—U.S. reserve assets,
- Page 310 and 311:
TABLE B-102.—Price changes in int