TABLE B-28.—Civilian employment and unemployment by sex and age 1947-76[Thousands of persons 16 years of age and over; monthly data seasonally adjusted]EmploymentUnemploymentYear ormonthTotalTotalMales16-19years20yearsandoverTotalFemales16-19years20yearsandoverTotalTotalMales16-19years20yearsandoverTotalFemale16-19yearsj20yearsandover1947...1948...1949...1950...1951...1952...19531..1954...1955...1956...1957...1958...1959...19601..1961...1962 i._1963...1964...1965...1966...1967...1968...1969...1970 .1971...19721..19731..1974...1975...1976...1975:Jan.._Feb..Mar..Apr..May..June..July..Aug.Sept..Oct...Nov..Dec.1976:Jan..Feb..Mar..Apr .May..June.July..Aug_.Sept..Oct..Nov..Dec.57,03858, 34357,65158,91859,96160, 25061,17960,10962,17063,79964, 07163, 03664,63065, 77865,74666,70267. 76269,30571,08872,89574,37275,92077,90278,62779,12081.70284,40985, 93684,78387, 48584, 67384, 25984, 24384, 24684, 47584, 49684, 85685,11485,11585, 08785,21285, 44386,22686, 47186, 84587, 32987, 64087, 53387, 78387,83487, 79487, 73888, 22088, 44140, 99441,72640, 92641,58041,78041,68442,43141,62042,62143,38043, 35742,42343,46643, 90443, 65644,17744,65745,47446, 34046,91947,47948,11448,81848,96049,24550, 63051,96352, 51951,23052, 39151, 39951, 19251, 06750, 96051,13851, 02451,26751,36551^29651,24451, 32451, 40151,78951,94252, 07852, 39752, 49052, 33252, 50752,59652, 54652,57652, 64352,7992,2182,3452,1242,1862,1562,1062,1351,9852,0952,1642,1172,0122,1982,3602,3142,3622,4062,5872,9183,2523,1863,2553,4303,4073,4703,7504,0174,0743,8033,9043,8503,8063,8053,7533,8513,7583,7993,7753,8203,7853,8123,7943,8483,8633,8773,9423,9483,8893,9633,9583,8453,8923,8703,94038,77639,38238, 80339,39439,62639.57840, 29639,63440, 52641,21641,23940,41141,26741,54341,34241,81542,25142, 88643,42243,66844,29344,85945,38845, 55345.77546.88047,94648, 44547,42748, 48647, 54947, 38647, 26247, 20747, 28747,26647, 46847, 59047,47647, 45947,51247, 60747,94148, 07948, 20148, 45548, 54248, 44348, 54448, 63848, 70148, 68448, 77348, 85916,04516,61816,72317,34018,18218,57018,75018,49019,55020,42220,71420,61321,16421,87422, 09022,52523,10523,83124,74825, 97626,89327, 80729,08429,66729,87531.07232,44633,41733, 55335, 09533,27433, 06733,17633,28633, 33733, 47233, 58933, 74933, 81933, 84333, 88834, 04234,43734, 52934, 76734, 93235,15035,20135, 27635, 23835, 24835,16235, 57735, 6421,6911,6831,5881,5171,6111,6121,5841,4901,5481,6541,6631,5701,6401,7691,7931,8331,8491,9292,1182,4692,4972,5252,68614,35414,93715,13715, 82416,57016,95817,16417,00018,00218,76719,05219,04319,52420,10520, 29620,69321,25721,90322,63023,51024, 39725,28126,3972,734 26.9332,725j 27! 1492.972 28.1003,219 29,2283,329 30, 0883,243 30,3103,365 31,7303,2983,2323,2013,2233,2443,2453,2093,2453,2723,2213,2283,2753,2963,3013,3533,3863,4793,4003,4233,3553,3423,3513,3693,30229, 97629, 83529,97530, 06330, 09330, 22730, 38030, 50430, 54730, 62230, 66030, 76731,14131, 22831,41431, 54631,67131,80131, 85331,88331,90631,81132,20832,3402,3112,2763,6373,2882,0551,8831,8343,5322,8522,7502.8594,6023,7403,8524,7143,9114,0703,7863,3662,8752,9752.8172,8324,0884.9934,8404,3045,0767,8307,2887,2807,3627,7777,9648,3148,0998,0617,9218,0118,0487,8137,7057,2477,1267,0177,0476,9117,1717,4067,5177,4487,5647,6517,5191,6921,5592,5722,2391,2211,1851,2022,3441,8541,7111,8413,0982,4202,4862,9972,4232,4722,2051,9141,5511,5081,4191,4032,2352,7762.6352,2402,6684,3853,9683,9194,0704,2894,4454,6654,6024,6134,4584,6154,5984,4304,2563,9493,8583,7983,8123,8303,9314,0203,9684,0604,1784,2444,1522702553523181912051843102742692994163984254794075004874794324484274415996917076477499579289249439519729551,0661,0099889329358929229469209249909378828899089109509519331,4221, 3052,2191,9221,0299801,0192,0351,5801,4421,5412, 6812,0222,0602,5182,0161,9711,7181,4351,1201,0609939631,6362,0861.9281,5941,9183,4283,0412,9953,1273,3383,4733,7103,5363,6043,4703,6833,6633,5383,3343,0032,9382,8742,8222,8933,0493,1313,0603,1503,2283,2933,2196197171,0651,0498346986321,1889981,0391,0181,5041,3201,3661,7171,4881,5981,5811,4521,3241,4681,3971,4291,8532,2172.2052,0642,4083,4453,3203,3613,2923,4883,5193,6493,4973,4483,4633,3963,4503,3833,4493,2983,2683,2193,2353,0813,2403,3863,5493,3883,3863,4073,36714415222319514514012319117620919726225628634931338338639540439141241250656759557966079577380275580575185576980082579980276582177977577576875376375287075475376776947E5648418546895595109978238328211,2421,063l,08C1,3681.17E1,2161.19E1,0569211, 07f98Ei,oie1.34J1,65(1.6K1,48!1,7412,64
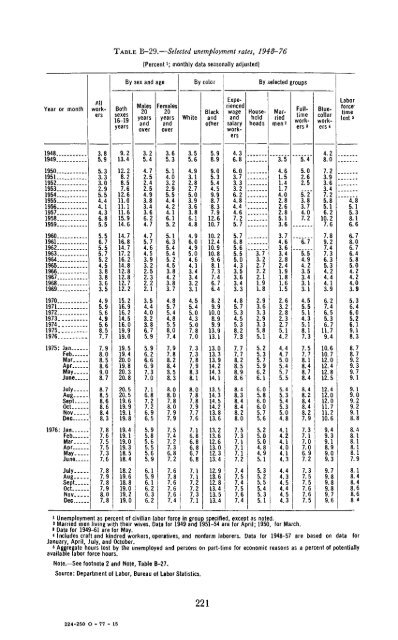
TABLE B-29.—Selected unemployment rates, 1948-76[Percent 1 ; monthly data seasonally adjusted]By sex and ageBy colorBy selected groupsYear or monthBothsexes16-19yearsMales20yearsandover: emales20yearsandoverWhiteBlackandotherAllworkersExperiencedwageandsalaryworkersHouseholdheadsMarriedFulltimeworkers3Bluecollarworkers*Laborforce*timelost *194819493.85.99.213.43.25.43.65.33.55.65.98.94.36.83.55.44.28.01950195119521953195419551956195719581959 .. .5.33.33.02.95.54.44.14 36 85.512.28.28.57.612.611.011.111.615.914.64.72.52.42.54.93.83.43 66.24.75.14.03.22.95.54.44.24.16.15.24.93.12.82.75.03.93.63 86.14.89.05.35.44.59.98.78.37 912.610.76.03.73.33.26.24.84.44.67.25.74.61.51.41.74.02.82.62.85.13.65.02.62.55.23.83.74.07.27.23.93.63.47.25.85.16.210.27.64.85.15.38.16.6196019611962196319641965196619671968...19695.56 75.55.75.24.53 83.83.63.514.716.814.717.216.214.812.812.812.712.24.75.74.64.53.93.22.52.32.22.15.16.35.45.45.24.53.84.23.83.74.96.04.95.04 64.13 43.43.23.110.212.410.910.89.68.17 37.46.76.45.76.85.65.55.04.33 53.63.43.33.73.22.72.22.11.91.83.74.63.63.42.82.41.91.81.61.56.75.54.94.23.53.43.13.17.89.27.47.36.35.34.24.44.13.96.78.06.76.45.85.04.24.24.03.919701971197219731974197519764.95.95.64 95 68 57 715.216.916.214 516 019.919 03.54.44.03 23 86.75 94.85.75.44 85 58.07 44.55.45.04 35.07 87 08.29.910.08 99 913.913 14.85.75.34 55 38.27 32.93.63.32.93.35.85 12.63.22.82 32.75.14 24.55.55.14 35.18.17 36.27.46.55 36.711.79 45.36.46.05.26 19.18 31975: JanFebMarApr.MayJune7.98.08.58 69 08.719.519.420.019 820 320.85.96.26.66 97 37.07.97.88.28 48 58.37.37.37.87 98 38.113.013.313.914 214 314.17.77.78.28 58 98.65.25.35.75 96 26.14.44.75.05 45 75.57.57.78.18 48 78.410.610.712.012 412 812.58.78.79.29.39.79.1JulyAugSeptOctNovDec1976: JanFebMarAprMayJune8.78 58.68.68.48.37.87.67.57.57.37.620.520 519.619.919.119.819.419.119.019.318.518.47.16 87.27.26.96.55.95.85.65.55.65.98.08 07.88.07.97.97.57.47.27.36.87.28.07 87.87.97.77.67.16.86.86.86.76.813.5U 314.514.213.813.613.213.612.613.012.313.48.48 38.48.48.28.07.57.37.17.17.17.26.05 86.06.05.75.65.25.05.04.84.95.15.45 35.45.35.04.84.14.24.14.04.14.38.48 28.48.48.27.97.37.17.07.06.97.212.412 012.011.711.210.69.49.39.18.99.09.39.19 C9.29.29.18.88.48.18.18.18.17.9JulyAugSept....OctNovDec7.87.97.87.98.07.818.219.618.819.019.219.06.15.96.16.26.36.27.67.87.67.67.6,47.17.17.27.27.37.112.913.612.813.413.513.47.47.57.47.57.67.45.35.25.55.45.35.14.44.34.54.44.54.37.37.57.57.67.67.59.79.89.89.89.79.68.18.48.48.68.6S A1 Unemployment as percent of civilian labor force in group specified, except as noted.* Married men living with their wives. Data for 1949 and 1951-54 are for April; 1950, for March.» Data for 1949-61 are for May.4 Includes craft and kindred workers, operatives, and nonfarm laborers. Data for 1948-57 are based on data forJanuary, April, July, and October.4 Aggregate hours lost by the unemployed and persons on part-time for economic reasons as a percent of potentiallyavailable labor force hours.Note.—See footnote 2 and Note, Table B-27.Source: Department of Labor, Bureau of Labor Statistics.221224-250 O - 77 - 15
- Page 1:
ECONOMICTRANSMITTEDTO THE CONGRESSJ
- Page 5:
CONTENTSPageECONOMIC REPORT OF THE
- Page 9 and 10:
ECONOMIC REPORT OF THE PRESIDENTTo
- Page 11 and 12:
manent tax rate reductions. My prop
- Page 13 and 14:
will help shield us from disruption
- Page 15 and 16:
executive branch must undertake a c
- Page 17:
lasting implications of the changes
- Page 21:
THE PRESIDENT:LETTER OF TRANSMITTAL
- Page 24 and 25:
CHAPTER 2. ECONOMIC REVIEW OF 1976
- Page 26 and 27:
List of Tables and Charts—Continu
- Page 29 and 30:
CHAPTER 1Economic Policy and Outloo
- Page 31 and 32:
GENERAL POLICY PRINCIPLESTo assure
- Page 33 and 34:
3. Economic initiatives should be b
- Page 35 and 36:
TABLE 1.—The market value and the
- Page 37 and 38:
on investment would increase with i
- Page 39 and 40:
MONETARY POLICYThe Federal Reserve
- Page 41 and 42:
like the latter part of 1976. The 4
- Page 43 and 44:
PRIVATE CONSUMPTIONThe growth of re
- Page 45 and 46:
NET EXPORTSIn real terms net export
- Page 47 and 48:
LABOR FORGE AND UNEMPLOYMENTIt is e
- Page 49 and 50:
led to large first-year catchup inc
- Page 51 and 52:
Consumer prices of fuels during 197
- Page 53 and 54:
other workers. Productivity is meas
- Page 55 and 56:
Since the mid-1950s a dramatic chan
- Page 57 and 58:
women's labor force participation;
- Page 59 and 60:
The full-employment benchmark has b
- Page 61 and 62:
Chart 4Gross National Product, Actu
- Page 63 and 64:
groups can be a useful supplement t
- Page 65 and 66:
TABLE 7.—Changes in gross nationa
- Page 67 and 68:
Relative price movements were appar
- Page 69 and 70:
August was followed by a 20 percent
- Page 71 and 72:
main price indexes were significant
- Page 73 and 74:
A broader measure of labor costs, c
- Page 75 and 76:
TABLE 13.—Output, profits, net in
- Page 77 and 78:
TABLE 15.—Federal Government rece
- Page 79 and 80:
In the unified budget the total sho
- Page 81 and 82:
The permanent changes in the Tax Re
- Page 83 and 84:
tial output and the full-employment
- Page 85 and 86:
For this reason, although the rate
- Page 87 and 88:
quarter a year later. The actual gr
- Page 89 and 90:
Partly as a result of the desire of
- Page 91 and 92:
widespread among demographic groups
- Page 93 and 94:
of longer-term trends. Over the pas
- Page 95 and 96:
ment and earnings show little cycli
- Page 97 and 98:
production or real GNP, and this al
- Page 99 and 100:
percent from 1973. The cost of petr
- Page 101 and 102:
COMMODITY MARKETS AND FOOD PRICESWo
- Page 103 and 104:
TABLE 25.—Real income per farm an
- Page 105 and 106:
While circumstances have enabled a
- Page 107 and 108:
The policy actions taken in 1975 an
- Page 109 and 110:
TABLE 27.—Changes in industrial p
- Page 111 and 112:
States some underspending by public
- Page 113 and 114:
continued strong domestically gener
- Page 115 and 116:
GENERAL DEMAND TRENDSEconomic devel
- Page 117 and 118:
PUBLIC SECTOR DEFICITSThe economic
- Page 119 and 120:
insurance funds. The requirement th
- Page 121 and 122:
TABLE 29.—Export shares in trade
- Page 123 and 124:
Chart 7—ContinuedINDEX, 1973=100
- Page 125 and 126:
widened and the possibility of borr
- Page 127 and 128:
Chart 8—ContinuedInterest Rates i
- Page 129 and 130:
Where stabilization policies are pe
- Page 131 and 132:
Germany grew more in line with outp
- Page 133 and 134:
TABLE 32.—Estimated disposition o
- Page 135 and 136:
ates, and tax changes that facilita
- Page 137 and 138:
facility is designed to help countr
- Page 139 and 140:
is necessary that the strongest eco
- Page 141 and 142:
A freezing of relative prices, eith
- Page 143 and 144:
implicit and explicit subsidies bui
- Page 145 and 146:
qualitative conclusions. For exampl
- Page 147 and 148:
For some youths unemployment is inv
- Page 149 and 150:
may be as low as 10 percent. Thus t
- Page 151 and 152:
large subsidies through the tax cre
- Page 153 and 154:
in the transportation and public ut
- Page 155 and 156:
trust exemption permits motor carri
- Page 157 and 158:
purchase less expensive air travel.
- Page 159 and 160:
produced with higher-cost energy so
- Page 161 and 162:
of establishing efficient methods o
- Page 163 and 164:
in the future. Consequently current
- Page 165 and 166:
demand and supply at support prices
- Page 167 and 168:
with stringent controls on peanut a
- Page 169 and 170:
aspects of the tax system which imp
- Page 171 and 172:
TABLE 35—Change in aUer-tax inter
- Page 173 and 174:
and raise the return to capital inc
- Page 175: come, social security encourages pe
- Page 179: LETTER OF TRANSMITTALCOUNCIL OF ECO
- Page 182 and 183: RESPONSIBILITIES OF THE COUNCILThe
- Page 184 and 185: the Administration's economic polic
- Page 186 and 187: member of the senior staff, and Rob
- Page 189 and 190: CONTENTSNATIONAL INCOME OR EXPENDIT
- Page 191: PageB-76. Estimated ownership of pu
- Page 194 and 195: TABLE B-2.—Gross national product
- Page 196 and 197: TABLE B-3.—Implicit price deflato
- Page 198 and 199: TABLE B-4.—Implicit price deflato
- Page 200 and 201: TABLE B~6.—Gross national product
- Page 202 and 203: TABLE B-8.—Gross national product
- Page 204 and 205: TABLE B-9.—Gross national product
- Page 206 and 207: TABLE B-ll.—Gross domestic produc
- Page 208 and 209: TABLE B-13.—Personal consumption
- Page 210 and 211: TABLE B-15.—Inventories and final
- Page 212 and 213: TABLE B-17.—Relation of gross nat
- Page 214 and 215: TABLE B-19.—National income by ty
- Page 216 and 217: TABLE B-20.—Sources of personal i
- Page 218 and 219: TABLE B-21.—Disposition of person
- Page 220 and 221: 19291933Year orquarter1939...194019
- Page 222 and 223: TABLE B~25.- -Number and money inco
- Page 224 and 225: TABLE B-27.—Noninstitutional popu
- Page 228 and 229: TABLE B-30.— Unemployment by dura
- Page 230 and 231: TABLE B-32.—Wage and salary worke
- Page 232 and 233: TABLE B-33.—Average weekly hours
- Page 234 and 235: TABLE B-35.—Productivity and rela
- Page 236 and 237: PRODUCTION AND BUSINESS ACTIVITYTAB
- Page 238 and 239: TABLE B-39.—Industrial production
- Page 240 and 241: TABLE B-41.—New construction acti
- Page 242 and 243: TABLE B-42.—New housing units sta
- Page 244 and 245: TABLE B-44.—Sales and inventories
- Page 246 and 247: TABLE B-46.'—Manufacturers 1 new
- Page 248 and 249: TABLE B-48.—Consumer price indexe
- Page 250 and 251: TABLE B—50.—Consumer price inde
- Page 252 and 253: TABLE B-52.—Percent changes in co
- Page 254 and 255: 19291933193919401941194219431944194
- Page 256 and 257: TABLE B-54.—Wholesale price index
- Page 258 and 259: TABLE B-56.—Percent changes in wh
- Page 260 and 261: TABLE B-58.—Commercial bank loans
- Page 262 and 263: TABLE B-60.—Total funds raised in
- Page 264 and 265: TABLE B-61.—Federal Reserve Bank
- Page 266 and 267: TABLE B-63.—Bond yields and inter
- Page 268 and 269: TABLE B-64,—Instalment credit ext
- Page 270 and 271: TABLE B-66.— Mortgage debt outsta
- Page 272 and 273: GOVERNMENT FINANCETABLE B-68.—Fed
- Page 274 and 275: TABLE B-69.—Federal budget receip
- Page 276 and 277:
TABLE B-71.—Receipts and expendit
- Page 278 and 279:
TABLE B-73.—Receipts and expendit
- Page 280 and 281:
TABLE B-75.—Interest-bearing publ
- Page 282 and 283:
TABLE B-77.—Average length and ma
- Page 284 and 285:
TABLE B-79.—Corporate profits by
- Page 286 and 287:
TABLE B—80.—-Corporate profits
- Page 288 and 289:
TABLE B1-81.—Sales, profits, and
- Page 290 and 291:
TABLE B-83.—Relation of profits a
- Page 292 and 293:
TABLE B-85.—Current assets and li
- Page 294 and 295:
TABLE B-87.—Common stock prices a
- Page 296 and 297:
192919331939Year orquarter19401941
- Page 298 and 299:
TABLE B-91.—Farm population, empl
- Page 300 and 301:
TABLI. B-93.—Selected measures of
- Page 302 and 303:
INTERNATIONAL STATISTICSTABLE B-95.
- Page 304 and 305:
TABLE B-96.—U.S. merchandise expo
- Page 306 and 307:
TABLE B-98.—U.S. overseas loans a
- Page 308 and 309:
TABLE B-100.—U.S. reserve assets,
- Page 310 and 311:
TABLE B-102.—Price changes in int