

ECONOMIC
Report - The American Presidency Project
Report - The American Presidency Project
- No tags were found...

You also want an ePaper? Increase the reach of your titles
YUMPU automatically turns print PDFs into web optimized ePapers that Google loves.
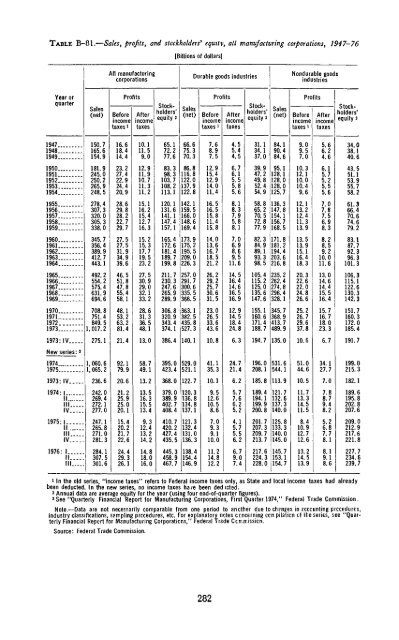
TABLE B1-81.—Sales, profits, and stockholders' eqmtv, all manufacturing corporations, 1947-761976: 1 284.1 24.4 14.8II 307.5 29.3 18.0Ill 301.6 26.1 16.01Ml manufacturingcorporationsYear orProfitsquarterSalestaxes i taxes(net) BeforeincomeAfterincome1947150.7 16.6 10.11948165.6 18.4 11.51949154.9 14.4 9.01950181.9 23.2 12.91951245.0 27.4 11.91952250.2 22.9 10.71953265.9 24.4 11.31954248.5 20.9 11.21955.278.4 28.6 15.11956307.3 29.8 16.21957320.0 28.2 15.41958305.3 22.7 12.71959338.0 29.7 16.31960345 7 27 5 15.21961356.4 27.5 15.31962389.9 31.9 17.71963 . . .. 412.7 34.9 19.51964443.1 39 6 23.21965492.2 46.5 27.51966554.2 51.8 30.91967 . . 575.4 47.8 29.01968631.9 55.4 32.11969694. 6 58.1 33.21970708 8 48 1 28 61971751.4 53.2 31.31972849.5 63.2 36.51973 1,017.2 81.4 48.11973: IVNew series: 8197419751973: IV275.11, 060.61, 065.2236.621.492.179.920.613.058.749.113.21974:1 242.0 21.2 13.5II 269.4 25.9 16.3Ill 272.1 25.0 15.5IV 277.0 20.1 13.41975: | 247.1 15.4 9.3II 265.8 20.2 12.4Ill 271.0 21.7 13.2IV 281.3 22.6 14.2Stockholders'equity 265.172.277.683.398.3103.7108.2113.1120.1131.6141.1147.4157.1165.4172.6181.4189.7199.8211.7230.3247.6265.9289.9306.8320.9343.4374.1386.4395.0423.4368.0379.0389.9402.7408.4410.7420.2427.4435.5445.3458.9467.7[Billions of dollars]Sales(net)66.675.370.386.8116.8122.0137.9122.8142.1159.5166.0148.6169.4173.9175.2195.5209.0226.3257.0291.7300.6335.5366.5363.1382.5435.8527.3140.1529.0521.1122.7120.3136.8134.8137.1121.3132.4131.0136.3138.4154.4146.9Durable goods industriesProfitsBeforeincometaxes 17.68.97.512.915.412.914.011.416.516.515.811.415.814.013.616.718.521.226.229.225.730.631.523.026.533.643.610.841.135.310.19.512.610.58.67.09.39.110.011.214.812.2Afterincometaxes4.55.44.56.76.15.55.85.68.18.37.95.88.17.06.98.69.511.614.516.414.616.516.912.914.518.424.86.324.721.46.25.77.66.25.24.15.75.56.26.79.07.4Stockholders'equity 231.134.137.039.947.249.852.454.958.865.270.572.877.982.384.989.193.398.5105.4115.2125.0135.6147.6155.1160.6171.4188.7194.7196.0208.1185.8189.4194.1199.9200.8201.7207.3209.7213.7217.6224.3228.0Sales(net)84.190.484.695.1128.1128.0128.0125.7136.3147.8154.1156.7168.5171.8181.2194.4203.6216.8235.2262.4274.8296.4328.1345.7368.9413.7489.9135.0531.6544.1113.9171.7132.6137.3140.0125.8133.3140.0145.0145.7153.1154.7Nondurable goodsindustriesProfitsBeforeincometaxes 19.09.57.010.312.110.010.49.612.113.212.411.313.913.513.915.116.418.320.322.622.024.826.625.226.729.637.810.651.044.610.511.713.314.511.58.410.912.712.613.214.513.9Afterincometaxes5 66.24.66.15.75.25.55.67.07.87.56.98.38 28.59.210.011 613.014.614.415.516.415.716.718.023.36.734.127.77.07.88.79.48.25.26.87.78.18.19.18.6Stockholders'equity 234 038.140.643.551 153.955.758.261.366 470.674.679 283 187.792.396.3101 3106.3115.1122.6130.3142.3151.7160.3172.0185.4191.7199.0215.3182.1189.6195.8202.8207.6209.0212.9217.6221.8227.7234.6239.71 In the old series, "income taxes" refers to Federal income taxes only, as State and local income taxes had alreadybeen deducted. In the new series, no income taxes ha/e been dedicted.2 Annual data are average equity for the year (using four end-of-quarter figures).3 See "Quarterly Financial Report for Manufacturing Corporations, First Quarter 1974," Federal Trade Commission.Note.—Data are not necessarily comparable from one period to another due to changes in accounting prccedures,industry classifications, sampling prccedures, etc. For explanatory notes concerning ccrr pilaticn cf the series, see "QuarterlyFinancial Report for Manufacturing Corporations," Federal Trade Ccrrrrissicn.Source: Federal Trade Commission.282


