TABLE B-21.—Disposition of personal income, 1929-76(Billions of dollars; quarterly data at seasonally adjusted annual rates, except as noted]Year orquarter19291933193919401941.. ..194219431944.194519461947.1948194919501951 . .1952.. ..19531954.195519561957.. ..19581959..19601961196219631964196519661967.. .196819691970197119721973197419751976 v1974:1....II....III...IV...1975:1....II.—III...IV...1976: 1 II....III...IV*>_.Personalincome84.946.972.477.895.3122.4150.7164.4169.8177.3189.8208.5205.6226.1253.7270.4286.1288.2308.8330.9349.3359.3382.1399.7415.0440.7463.1495.7537.0584.9626.6685.2745.8801.3859.1942.51, 052.41,153.31, 249.71, 375.41,109.71,136.81,172.51,194.11,203.1l f 230. 31,265. 51, 299.71,331.31, 362. 01, 386.01, 422.1Less:Personaltaxandnontaxpayments2.61.42.42.63.35.917 818.920.818 721.421.018.520 628.934.035.532.535.439.742.442.146.050.452.156.860.358.664.974.582.197.1115.4115.3116.3141.2150.8170.4168.8193.6161.3167.4174.5178.3179.3142.2174.0179.8183.8189.5195.8205.3Equals:Disposablepersonalincome82.345.569.975.292.0116.5132.9145.5149.0158.6168.4187.4187.1205.5224.8236.4250.7255.7273.4291.3306.9317.1336.1349.4362.9383.9402.8437.0472.2510.4544.5588.1630.4685.9742.8801.3901.7982.91, 080.91,181.8948.4969.5998.01,015.81,023.81, 088.21,091.51,119.91,147.61,172.51,190.21,216.9Less: Personal outlaysTotal79.146.567.872.081.889.4100.1109.0120.4145.2163.5176.9180.4194.7210.0220.4233.7240.1258.5271.6286.4295.4317.3332.3342.7363.5384.0410.9441.9477.4503.7550.1595.3635.4685.5751.9831.3910.7996.91,104.0875.8901.6930.4935.0956.7983.61,011.11, 036.21, 068.01, 089.61,114.31,144. 0Personalconsumptionexpenditures77.345.867.071.080.888.699.4108.2119.5143.8161.7174.7178.1192.0207.1217.1229.7235.8253.7266.0280.4289.5310.8324.9335.0355.2374.6400.4430.2464.8490.4535.9579.7618.8668.2733.0809.9887.5973.21,078.6853.3878.7906.8911.1933.2960.3987.31,012.01,043.61,064.71, 088.51,117.5Interestpaid byconsumerstobusiness1.5.5.7.8.9.5.5.5.71.01.41.72.32.52.93.63.84.45.15.55.66.17.07.37.88.89.911.112.012.513.314.715.516.217.920.222.222.824.421.421.922.622.922.522.422.823.323.423.924.825.5Personaltransferpaymentsto foreigners(net)0.3.2.2.2.2.1.2.4.5.7< .7.7.5.4.4.4.5.5.5.5.4.4.4.4.5.6.6.7.6.9.8.91.11.11.01.31.0.91.11.11.01.01.0.9.9.9.91.01.01.11.1Equals:Personalsaving3.1-1.02.13.310.227.032.736.528.513.44.910.66.710.814.816.017.015.614.919.720.621.718.817.120.220.418.826.130.333.040.938.135.150.657.349.470.372.284.077.872.667.867.680.867.2104.580.583.779.582.975.872.9Percent of disposablepersonal incomePersonaloutlaysTotal96.2102.297.095.688.976.875.474.980.891.597.194.396.494.793.493.293.293.994.693.293.393.294.495.194.494.795.394.093.693.592.593.594.492.692.393.892,292.792.293.492.393.093.292.093.490.492.692.593.192.993.694.0Consumptionexpenditures93.9100.795.894.387.776.174.874.480.290.696.193.295.293.492.191.891.692.292.891.391.491.392.593.092.392.593.091.691.191.190.091.192.090.290.091.589.890.390.091.390.090.690.989.791.288.290.590.490.990.891.591.8Personalsaving3.8-2.23.04.411.123.224.625.119.28.52.95.73.65.36.66.86.86.15.46.86.76.85.64.95.65.34.76.06.46.57.56.55.67.47.76.27.87.37.86.67.77.06.88.06.69.67.47.56.97.16.46.0Source: Department of Commerce, Bureau of Economic Analysis.212
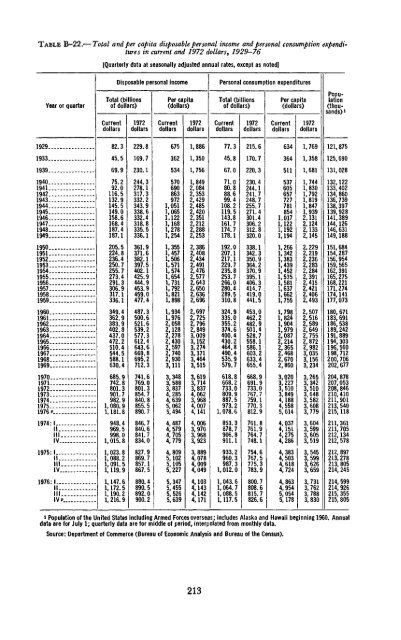
TABLE B-22.—Total and per capita disposable personal income and personal consumption expendituresin current and 1972 dollars, 1929-76[Quarterly data at seasonally adjusted annual rates, except as noted]Disposable personal incomePersonal consumption expendituresYear or quarterTotal (billionsof dollars)Per capita(dollars)Total (billionsof dollars)Per capita(dollars)Population(thousands)lCurrentdollars1972dollarsCurrentdollars1972dollarsCurrentdollars1972dollarsCurrentdollars1972dollars1929..82.3229.86751,88677.3215.66341,769121, 8751933..45.5169.73621,35045.8170.73641,358125.6901939-69.9230.15341,75667.0220.35111, 681131, 0281940..1941..1942..1943..1944..1945..1946..1947-1948-1949-1950..1951-1952..1953..1954..1955..1956..1957-1958..1959..75.292.0116.5132.9145.5149.0158.6168.4187.4187.1205.5224.8236.4250.7255.7273.4291.3306.9317.1336.1244.3278.1317.3332.2343.9338.6332.4318.8335.5336.1361.9371.6382.1397.5402.1425.9444.9453.9459.0477.45706908639721,0511,0651,1221,1681,2781,2541,3551,4571,5061,5711,5741,6541,7311,7921,8211,8981,8492,0842,3532,4292,4852,4202,3512,2122,2882,2532,3862,4082,4342,4912,4762,5772,6432,6502,6362,69671.080.888.699.4108.2119.5143.8161.7174.7178.1192.0207.1217.1229.7235.8253.7266.0280.4289.5310.8230.4244.1241.7248.7255.7271.4301.4306.2312.8320.0338.1342.3350.9364.2370.9395.1406.3414.7419.0441.55376056577277818541,0171,1221,1921,1941,2661,3421,3831,4391,4521,5351,5811,6371,6621,7551,7441,8301,7921,8191,8471,9392,1312,1242,1332,1452,2292,2192,2362,2832,2842,3912,4152,4212,4062,493132,122133, 402134, 860136, 739138, 397139,928141,389144,126146, 631149,188151, 684154,287156,954159, 565162,391165,275168,221171, 274174,141177,073I960..1961_.1962..1963..1964..1965..1966.1967.1968.1969.1970...1971...1972...1973...1974...1975...1976 P..1974:1II-III.IV..349.4362.9383.9402.8437.0472.2510.4544.5588.1630.4685.9742.8801.3901.7982.91,080.91,181.8948.4969.5998.01,015.8487.3500.6521.6539.2577.3612.4643.6669.8695.2712.3741.6769.0801.3854.7840.8855.5890.7846.7840.6841.7834.01,9341,9762,0582,1282,2782,4302,5972,7402 9303,1113,3483,5883,8374,2854,6395,0625,4944,4874,5794,7054,7792,6972,7252,7962,8493,0093,1523,2743,3713,4643,5153,6193 7143,8374,0623,9684,0074,1414,0063,9703,9683,923324.9335.0355.2374.6400.4430.2464.8490.4535.9579.7618.8668.2733.0809.9887.5973.21,078.6853.3878.7906.8911.1453.0462.2482.9501.4528.7558.1586.1603.2633.4655.4668.9691.9733.0767.7759.1770.3812.9761.8761.9764.7748.11,7981,8241,9041,9792,0872,2142,3652,4682,6702,8603,0203,2273,5103,8494,1884,5585,0144,0374,1514,2754,2862,5072,5162,5892,6492,7552,8722,9823,0353,1563,2343,2653,3423,5103,6483,5823,6083,7793,6043,5993,6053,519180, 671183.691186,538189,242191,889194,303196,560198,712200,706202,677204,878207,053208, 846210,410211,901213, 540215,118211,361211, 705212,134212, 5781975:1—II..111.IV..1, 023. 8"., 088.2., 091.5,119.9827.9869.7857.1867.54,8095,1025,1055,2273,8894,0784,0094,049933.2960.3987.31,012.0754.6767.5775.3783.94,3834,5034,6184,7243,5453,5993,6263,659212, 897213, 278213, 805214, 2451976:1..II.IV *,147.6, 172.5, 190.21,216.9880.4890.5892.0900.25,3475,4555,5265,6394,1034,1434,1424,1711,043.61, 064.71, 088. 51,117.5800.7808.6815.7826.64,8634,9545,0545,1783,7313,7623,7883,830214, 599214,926215, 355215, 805» Population of the United States including Armed Forces overseas; includes Alaska and Hawaii beginning 1960. Annualdata are for July 1; quarterly data are for middle of period, interpolated from monthly data.Source: Department of Commerce (Bureau of Economic Analysis and Bureau of the Census).213
- Page 1:
ECONOMICTRANSMITTEDTO THE CONGRESSJ
- Page 5:
CONTENTSPageECONOMIC REPORT OF THE
- Page 9 and 10:
ECONOMIC REPORT OF THE PRESIDENTTo
- Page 11 and 12:
manent tax rate reductions. My prop
- Page 13 and 14:
will help shield us from disruption
- Page 15 and 16:
executive branch must undertake a c
- Page 17:
lasting implications of the changes
- Page 21:
THE PRESIDENT:LETTER OF TRANSMITTAL
- Page 24 and 25:
CHAPTER 2. ECONOMIC REVIEW OF 1976
- Page 26 and 27:
List of Tables and Charts—Continu
- Page 29 and 30:
CHAPTER 1Economic Policy and Outloo
- Page 31 and 32:
GENERAL POLICY PRINCIPLESTo assure
- Page 33 and 34:
3. Economic initiatives should be b
- Page 35 and 36:
TABLE 1.—The market value and the
- Page 37 and 38:
on investment would increase with i
- Page 39 and 40:
MONETARY POLICYThe Federal Reserve
- Page 41 and 42:
like the latter part of 1976. The 4
- Page 43 and 44:
PRIVATE CONSUMPTIONThe growth of re
- Page 45 and 46:
NET EXPORTSIn real terms net export
- Page 47 and 48:
LABOR FORGE AND UNEMPLOYMENTIt is e
- Page 49 and 50:
led to large first-year catchup inc
- Page 51 and 52:
Consumer prices of fuels during 197
- Page 53 and 54:
other workers. Productivity is meas
- Page 55 and 56:
Since the mid-1950s a dramatic chan
- Page 57 and 58:
women's labor force participation;
- Page 59 and 60:
The full-employment benchmark has b
- Page 61 and 62:
Chart 4Gross National Product, Actu
- Page 63 and 64:
groups can be a useful supplement t
- Page 65 and 66:
TABLE 7.—Changes in gross nationa
- Page 67 and 68:
Relative price movements were appar
- Page 69 and 70:
August was followed by a 20 percent
- Page 71 and 72:
main price indexes were significant
- Page 73 and 74:
A broader measure of labor costs, c
- Page 75 and 76:
TABLE 13.—Output, profits, net in
- Page 77 and 78:
TABLE 15.—Federal Government rece
- Page 79 and 80:
In the unified budget the total sho
- Page 81 and 82:
The permanent changes in the Tax Re
- Page 83 and 84:
tial output and the full-employment
- Page 85 and 86:
For this reason, although the rate
- Page 87 and 88:
quarter a year later. The actual gr
- Page 89 and 90:
Partly as a result of the desire of
- Page 91 and 92:
widespread among demographic groups
- Page 93 and 94:
of longer-term trends. Over the pas
- Page 95 and 96:
ment and earnings show little cycli
- Page 97 and 98:
production or real GNP, and this al
- Page 99 and 100:
percent from 1973. The cost of petr
- Page 101 and 102:
COMMODITY MARKETS AND FOOD PRICESWo
- Page 103 and 104:
TABLE 25.—Real income per farm an
- Page 105 and 106:
While circumstances have enabled a
- Page 107 and 108:
The policy actions taken in 1975 an
- Page 109 and 110:
TABLE 27.—Changes in industrial p
- Page 111 and 112:
States some underspending by public
- Page 113 and 114:
continued strong domestically gener
- Page 115 and 116:
GENERAL DEMAND TRENDSEconomic devel
- Page 117 and 118:
PUBLIC SECTOR DEFICITSThe economic
- Page 119 and 120:
insurance funds. The requirement th
- Page 121 and 122:
TABLE 29.—Export shares in trade
- Page 123 and 124:
Chart 7—ContinuedINDEX, 1973=100
- Page 125 and 126:
widened and the possibility of borr
- Page 127 and 128:
Chart 8—ContinuedInterest Rates i
- Page 129 and 130:
Where stabilization policies are pe
- Page 131 and 132:
Germany grew more in line with outp
- Page 133 and 134:
TABLE 32.—Estimated disposition o
- Page 135 and 136:
ates, and tax changes that facilita
- Page 137 and 138:
facility is designed to help countr
- Page 139 and 140:
is necessary that the strongest eco
- Page 141 and 142:
A freezing of relative prices, eith
- Page 143 and 144:
implicit and explicit subsidies bui
- Page 145 and 146:
qualitative conclusions. For exampl
- Page 147 and 148:
For some youths unemployment is inv
- Page 149 and 150:
may be as low as 10 percent. Thus t
- Page 151 and 152:
large subsidies through the tax cre
- Page 153 and 154:
in the transportation and public ut
- Page 155 and 156:
trust exemption permits motor carri
- Page 157 and 158:
purchase less expensive air travel.
- Page 159 and 160:
produced with higher-cost energy so
- Page 161 and 162:
of establishing efficient methods o
- Page 163 and 164:
in the future. Consequently current
- Page 165 and 166:
demand and supply at support prices
- Page 167 and 168: with stringent controls on peanut a
- Page 169 and 170: aspects of the tax system which imp
- Page 171 and 172: TABLE 35—Change in aUer-tax inter
- Page 173 and 174: and raise the return to capital inc
- Page 175: come, social security encourages pe
- Page 179: LETTER OF TRANSMITTALCOUNCIL OF ECO
- Page 182 and 183: RESPONSIBILITIES OF THE COUNCILThe
- Page 184 and 185: the Administration's economic polic
- Page 186 and 187: member of the senior staff, and Rob
- Page 189 and 190: CONTENTSNATIONAL INCOME OR EXPENDIT
- Page 191: PageB-76. Estimated ownership of pu
- Page 194 and 195: TABLE B-2.—Gross national product
- Page 196 and 197: TABLE B-3.—Implicit price deflato
- Page 198 and 199: TABLE B-4.—Implicit price deflato
- Page 200 and 201: TABLE B~6.—Gross national product
- Page 202 and 203: TABLE B-8.—Gross national product
- Page 204 and 205: TABLE B-9.—Gross national product
- Page 206 and 207: TABLE B-ll.—Gross domestic produc
- Page 208 and 209: TABLE B-13.—Personal consumption
- Page 210 and 211: TABLE B-15.—Inventories and final
- Page 212 and 213: TABLE B-17.—Relation of gross nat
- Page 214 and 215: TABLE B-19.—National income by ty
- Page 216 and 217: TABLE B-20.—Sources of personal i
- Page 220 and 221: 19291933Year orquarter1939...194019
- Page 222 and 223: TABLE B~25.- -Number and money inco
- Page 224 and 225: TABLE B-27.—Noninstitutional popu
- Page 226 and 227: TABLE B-28.—Civilian employment a
- Page 228 and 229: TABLE B-30.— Unemployment by dura
- Page 230 and 231: TABLE B-32.—Wage and salary worke
- Page 232 and 233: TABLE B-33.—Average weekly hours
- Page 234 and 235: TABLE B-35.—Productivity and rela
- Page 236 and 237: PRODUCTION AND BUSINESS ACTIVITYTAB
- Page 238 and 239: TABLE B-39.—Industrial production
- Page 240 and 241: TABLE B-41.—New construction acti
- Page 242 and 243: TABLE B-42.—New housing units sta
- Page 244 and 245: TABLE B-44.—Sales and inventories
- Page 246 and 247: TABLE B-46.'—Manufacturers 1 new
- Page 248 and 249: TABLE B-48.—Consumer price indexe
- Page 250 and 251: TABLE B—50.—Consumer price inde
- Page 252 and 253: TABLE B-52.—Percent changes in co
- Page 254 and 255: 19291933193919401941194219431944194
- Page 256 and 257: TABLE B-54.—Wholesale price index
- Page 258 and 259: TABLE B-56.—Percent changes in wh
- Page 260 and 261: TABLE B-58.—Commercial bank loans
- Page 262 and 263: TABLE B-60.—Total funds raised in
- Page 264 and 265: TABLE B-61.—Federal Reserve Bank
- Page 266 and 267: TABLE B-63.—Bond yields and inter
- Page 268 and 269:
TABLE B-64,—Instalment credit ext
- Page 270 and 271:
TABLE B-66.— Mortgage debt outsta
- Page 272 and 273:
GOVERNMENT FINANCETABLE B-68.—Fed
- Page 274 and 275:
TABLE B-69.—Federal budget receip
- Page 276 and 277:
TABLE B-71.—Receipts and expendit
- Page 278 and 279:
TABLE B-73.—Receipts and expendit
- Page 280 and 281:
TABLE B-75.—Interest-bearing publ
- Page 282 and 283:
TABLE B-77.—Average length and ma
- Page 284 and 285:
TABLE B-79.—Corporate profits by
- Page 286 and 287:
TABLE B—80.—-Corporate profits
- Page 288 and 289:
TABLE B1-81.—Sales, profits, and
- Page 290 and 291:
TABLE B-83.—Relation of profits a
- Page 292 and 293:
TABLE B-85.—Current assets and li
- Page 294 and 295:
TABLE B-87.—Common stock prices a
- Page 296 and 297:
192919331939Year orquarter19401941
- Page 298 and 299:
TABLE B-91.—Farm population, empl
- Page 300 and 301:
TABLI. B-93.—Selected measures of
- Page 302 and 303:
INTERNATIONAL STATISTICSTABLE B-95.
- Page 304 and 305:
TABLE B-96.—U.S. merchandise expo
- Page 306 and 307:
TABLE B-98.—U.S. overseas loans a
- Page 308 and 309:
TABLE B-100.—U.S. reserve assets,
- Page 310 and 311:
TABLE B-102.—Price changes in int