TABLE B-46.'—Manufacturers 1 new and unfilled orders, 1947-76[Amounts in millions of dollars; monthly data seasonally adjusted!New orders'Unfilled orders»Unfilled ordersshipmentsratio 3Year or monthTotalDurable goodsindustriesTotalTotalCapitalgoodsindustries,nondefenseNondurablegoodsindustriesDurablegoodsindustriesNondurablegoodsindustriesTotalDurablegoodsindustriesNondurablegoodsindustries1947.1948.1949.1950..1951..1952..1953..1954..1955..1956..1957..1958..1959..15,25617,69315,61420,11023,90723,20423,58622,33527,46528,36827. 55927, 00230, 7246,3888,1266,63310,16512,84112,06112,14710, 76814,99615,36514,11113, 29016, 0038,8689,5668,9819,94511,06611,14311,43911,56612, 46913,00313, 44813,71214, 72034,47330,73624,04541,45667,26675,85761,17848,26660,00467, 37553,18347, 28052, 57128, 57926,61919,62235,43563, 39472,68058,63745,25056,24163, 88050, 35244, 46549, 2075,8944,1174,4236,0213,8723,1772,5413,0163,7633,4952,8312,8153,3643.423.633.873.353.073.004.124.274.554.003.673.530.961.121.04.85.86.941960..1961..1962..1963..1984..30, 23531,10433, 43635, 52438, 35715, 30315,75917,37418, 70920, 65214,93215,34516,06116,81517, 70545,06147, 38448, 60054,38467, 00142, 49144, 34545,98351,32163, 8062,5703,0392,6173,0633,1952.782.642.682.813.103.363.143.213.383.71.72.79.68.73.721965..1966..1967..1968..1969..1970..1971..1972..1973..1974..1975..1975:Jan..Feb..Mar..Apr..May_.June.July..Aug._Sept..Oct...Nov..Dec.1976:Jan..Feb..Mar..Apr..May..June-42,10046, 40247, 06250, 72054,01452, 09655,93764, 24676,21786, 98885,67380, 76081,15678, 96682,96883,11483, 48687,72088, 20589, 53390, 39290,62091, 81692, 82295,04498, 55098, 75699, 37999, 47623, 27826,17725,83128,14929, 93427, 44729,95135,14242, 88846, 57042.16440,15640.16538, 59040, 72341,15640, 37343, 53443, 36844,18143, 84044, 28245, 98545, 90447, 93051,11150, 24551, 35451, 2497,0797,8217,0537,5758,94711,16912,65610,89911,61910, 59310,15210, 75010, 56310, 30511,31910, 91511, 07011, H211, 36911,05411,66311, 90012,17312, 47612, 66612, 60718, 82320, 22521, 23222,57124, 07924, 64925, 98629,10433,32940, 41843, 50940, 60440, 99140, 37542, 24541, 95843.11344,18644, 83745, 35246, 55246, 33745, 83046, 91847.11447, 43948,51148, 02548, 22780,17498, 519105,114110,537116,330107, 460107,656122,362161, 766190, 271171, 438187, 094184, 255180, 656178,114176, 846174, 545174, 441173, 584172, 890172,104172,175171,438170,193169, 686170, 450170, 687171, 520172,05976, 39594, 689101,144106, 563112,158102,867102, 623116, 004154,361184, 697163, 582181, 795179, 097175, 445172, 762171, 350168, 760168, 332167,148166, 037164,634164, 368163, 582162,197161, 697162,426162, 525163, 322163, 9653,7783,8303,9703,9744,1724,5935,0336,3587,4045,5757,8565,2995,1585,2115,3515,4965,7846,1086,4366,8537,4707,8067,8567,9967,9898,0248,1628,1988, 0943.343.803.733.853.763.703.393.353.944.233.634.174.114.123.994.023.963.893.813.733.703.723.633.533.463.373.393.353.383.974.544.444.644.504.454.063.964.665.094.405.044.994.994.844.904.814.734.624.514.474.524.404.264.194.064.084.024.06.76.73.69.69.77.78.88.93.64.78.60.58.60.60.61.64.66.69.72.77.79.77.79.77.77.77.78.77July...Aug...Sept...Oct....NOVP_.99, 21497, 92498, 86999,701100,88851,18050, 38050, 06851, 07851, 98613, 77812,69013,46814, 30212, 79948, 03347, 54448,80148,62448,902171, 938170, 414170, 503172, 553172, 992164, 055162,787162, 795164, 607165, 2347,8837,6277,7087,9467,7583.383.313.333.433.374.043.974.024.124.05.76.73.72.77.741 Monthly average for year and total for month.2 Seasonally adjusted, end of period.3 Ratio of unfilled orders at end of period to shipments for period; excludes industries with no unfilled orders. Annualfigures relate to seasonally adjusted data for December.Source: Department of Commerce, Bureau of the Census.240
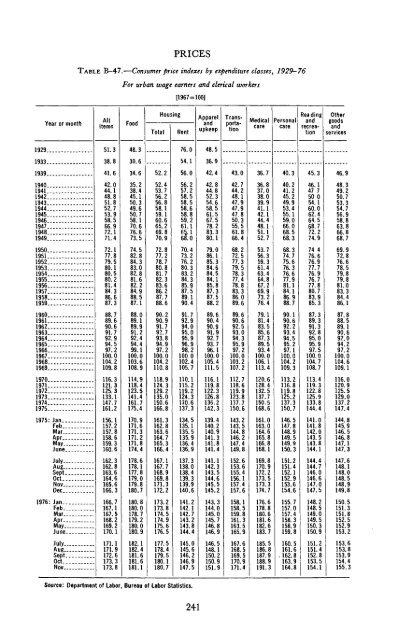
PRICESTABLE B-47.—Consumer price indexes by expenditure classes, 1929-76For urban wage earners and clerical workers[1967 = 100]Year or monthAllitemsFoodTotalHousingRentApparelandupkeepTransportationMedicalcarePersonalcareReadingandrecreationOthergoodsandservices1929193351 338 848 330 676.054.148.536.9193919401941194219431944194519461947194819491950195119521953 . .19541955195619571958195919601961196219631964196519661967196819691970197119721973 .197419751975: JanFebMar..AprMayJuneJulyAugSeptOctNovDec41.642.044.148.851.852.753.958.566.972.171.472.177.879.580.180.580.281.484.386.687.388.789.690.691.792.994.597.2100.0104.2109.8116.3121.3125 3133.1147.7161.2156.1157.2157.8158.6159.3160.6162.3162.8163 6164.6165.6166.334.635.238.445.150.349.650.758.170.676.673.574.582.884.383.082.881.682 284.988.587.188.089. i89.991.292.494.499.1100.0103.6108.9114.9118.4123.5141.4161.7175.4170.9171.6171.3171.2171.8174.4178.6178.1177.8179.0179.8180.752.252.453.756.256.858.159.160.665.269.870.972.877.278.780.881.782.383.686.287.788.690.290.991.792.793.894.997.2100.0104.2110.8118.9124.3129.2135.0150.6166.8161.3162.8163.6164.7165.3166.4167.1167.7168.9169.8171.3172.256.056.257.258.558.558.658.859.261.16§. 168.070.473.276.280.383.284.385 987.589.190.491.792.994.095.095.996.998.2100 0102.4105.7110.1115.2119.2124.3130.6137.3134.5135.1135.5135.9136.4136.9137.3138.0138.4139.3139.9140.642.442.844.852.354.658.561.567.578.283.380.179.086.185.384.684.584.185.887.387.588.289.690.490.991.992.793.796.1100.0105.4111.5116.1119.8122.3126.8136.2142.3139.4140.2140.9141.3141.8141.4141.1142.3143.5144.6145.5145.243.042.744.248.147.947.947.850.355.561.866.468.272.577.379.578.311A78.883.386.089.689.690.692.593.094.395.997.2100.0103.2107.2112.7118.6119.9123.8137.7150.6143.2143.5144.8146 2147.4149.8152.6153.6155 4156.1157.4157.636.736.837.038.039.941.142.144.448.151.152.753.756.359.361.463.464.867.269.973.276.479.181.483.585.687.389.593.4100.0106.1113.4120.6128.4132.5137.7150.5168.6161.0163.0164.6165.8166.8168.1169.8170.9172.2173.5173.3174.740.340.241.245.249.953.455.159.066.068.568.368.374.775.676.376.677.981.184.186.988.790.190.692.293.494.595 297.1100.0104.2109.3113.2116.8119.8125.2137.3150.7146.5147.8148.9149.5149.9150.3151.2151.4152.1152.9153.6154.645.346.147 750 054.160.062.464.568.772.274.974 476.676.977.776.976.777.880.783.985.387.389.391.392.895.095.997.5100.0104.7108.7113.4119.3122.8125.9133.8144.4141.0141.8142.0143.5143.8144.1144.4144.7146.0146.6147.0147.546.948.349.250.753.354.756.958 863.866.868.769.972.876.678.579.879.881 083.384.486 187 888.589.190 692.094 297.2100.0104.6109.1116.0120.9125.5129.0137 2147.4144.8145.9146.5146 8147.1147 3147.6148.1148 0148.5148.9149.81976: Jan... _FebMar.Apr__ _MayJuneJulyAugSeptOctNov166.7167.1167.5168.2169.2170.1171.1171.9172.6173.3173.8180.8180.0178.7179.2180.0180.9182.1182.418L6181 6181.1173.2173.8174.5174.9175.6176.5177.5178.4179.5180 1180.7141.2142.1142.7143.2143.8144.4145.0145.6146.2146 9147.5143.3144 0145.0145.7146.8146.9146 5148.1150.2150 9151.9158.1158 5159.8161.3163.5165.9167 6168.5169.5170 9171.4176.6178 8180.6181.6182.6183.7185.5186.8187.9188 9191.3155.7157 0157.4158.3158.9159.8160 5161.6.162.8163 9164.8148.2148.5149.0149.5150.3150.9151.2151.4152.8153.5154.1150.5151.3151.8152.5152.9153.2153.6153.8153.9154.4155.3Source: Department of Labor, Bureau of Labor Statistics.241
- Page 1:
ECONOMICTRANSMITTEDTO THE CONGRESSJ
- Page 5:
CONTENTSPageECONOMIC REPORT OF THE
- Page 9 and 10:
ECONOMIC REPORT OF THE PRESIDENTTo
- Page 11 and 12:
manent tax rate reductions. My prop
- Page 13 and 14:
will help shield us from disruption
- Page 15 and 16:
executive branch must undertake a c
- Page 17:
lasting implications of the changes
- Page 21:
THE PRESIDENT:LETTER OF TRANSMITTAL
- Page 24 and 25:
CHAPTER 2. ECONOMIC REVIEW OF 1976
- Page 26 and 27:
List of Tables and Charts—Continu
- Page 29 and 30:
CHAPTER 1Economic Policy and Outloo
- Page 31 and 32:
GENERAL POLICY PRINCIPLESTo assure
- Page 33 and 34:
3. Economic initiatives should be b
- Page 35 and 36:
TABLE 1.—The market value and the
- Page 37 and 38:
on investment would increase with i
- Page 39 and 40:
MONETARY POLICYThe Federal Reserve
- Page 41 and 42:
like the latter part of 1976. The 4
- Page 43 and 44:
PRIVATE CONSUMPTIONThe growth of re
- Page 45 and 46:
NET EXPORTSIn real terms net export
- Page 47 and 48:
LABOR FORGE AND UNEMPLOYMENTIt is e
- Page 49 and 50:
led to large first-year catchup inc
- Page 51 and 52:
Consumer prices of fuels during 197
- Page 53 and 54:
other workers. Productivity is meas
- Page 55 and 56:
Since the mid-1950s a dramatic chan
- Page 57 and 58:
women's labor force participation;
- Page 59 and 60:
The full-employment benchmark has b
- Page 61 and 62:
Chart 4Gross National Product, Actu
- Page 63 and 64:
groups can be a useful supplement t
- Page 65 and 66:
TABLE 7.—Changes in gross nationa
- Page 67 and 68:
Relative price movements were appar
- Page 69 and 70:
August was followed by a 20 percent
- Page 71 and 72:
main price indexes were significant
- Page 73 and 74:
A broader measure of labor costs, c
- Page 75 and 76:
TABLE 13.—Output, profits, net in
- Page 77 and 78:
TABLE 15.—Federal Government rece
- Page 79 and 80:
In the unified budget the total sho
- Page 81 and 82:
The permanent changes in the Tax Re
- Page 83 and 84:
tial output and the full-employment
- Page 85 and 86:
For this reason, although the rate
- Page 87 and 88:
quarter a year later. The actual gr
- Page 89 and 90:
Partly as a result of the desire of
- Page 91 and 92:
widespread among demographic groups
- Page 93 and 94:
of longer-term trends. Over the pas
- Page 95 and 96:
ment and earnings show little cycli
- Page 97 and 98:
production or real GNP, and this al
- Page 99 and 100:
percent from 1973. The cost of petr
- Page 101 and 102:
COMMODITY MARKETS AND FOOD PRICESWo
- Page 103 and 104:
TABLE 25.—Real income per farm an
- Page 105 and 106:
While circumstances have enabled a
- Page 107 and 108:
The policy actions taken in 1975 an
- Page 109 and 110:
TABLE 27.—Changes in industrial p
- Page 111 and 112:
States some underspending by public
- Page 113 and 114:
continued strong domestically gener
- Page 115 and 116:
GENERAL DEMAND TRENDSEconomic devel
- Page 117 and 118:
PUBLIC SECTOR DEFICITSThe economic
- Page 119 and 120:
insurance funds. The requirement th
- Page 121 and 122:
TABLE 29.—Export shares in trade
- Page 123 and 124:
Chart 7—ContinuedINDEX, 1973=100
- Page 125 and 126:
widened and the possibility of borr
- Page 127 and 128:
Chart 8—ContinuedInterest Rates i
- Page 129 and 130:
Where stabilization policies are pe
- Page 131 and 132:
Germany grew more in line with outp
- Page 133 and 134:
TABLE 32.—Estimated disposition o
- Page 135 and 136:
ates, and tax changes that facilita
- Page 137 and 138:
facility is designed to help countr
- Page 139 and 140:
is necessary that the strongest eco
- Page 141 and 142:
A freezing of relative prices, eith
- Page 143 and 144:
implicit and explicit subsidies bui
- Page 145 and 146:
qualitative conclusions. For exampl
- Page 147 and 148:
For some youths unemployment is inv
- Page 149 and 150:
may be as low as 10 percent. Thus t
- Page 151 and 152:
large subsidies through the tax cre
- Page 153 and 154:
in the transportation and public ut
- Page 155 and 156:
trust exemption permits motor carri
- Page 157 and 158:
purchase less expensive air travel.
- Page 159 and 160:
produced with higher-cost energy so
- Page 161 and 162:
of establishing efficient methods o
- Page 163 and 164:
in the future. Consequently current
- Page 165 and 166:
demand and supply at support prices
- Page 167 and 168:
with stringent controls on peanut a
- Page 169 and 170:
aspects of the tax system which imp
- Page 171 and 172:
TABLE 35—Change in aUer-tax inter
- Page 173 and 174:
and raise the return to capital inc
- Page 175:
come, social security encourages pe
- Page 179:
LETTER OF TRANSMITTALCOUNCIL OF ECO
- Page 182 and 183:
RESPONSIBILITIES OF THE COUNCILThe
- Page 184 and 185:
the Administration's economic polic
- Page 186 and 187:
member of the senior staff, and Rob
- Page 189 and 190:
CONTENTSNATIONAL INCOME OR EXPENDIT
- Page 191:
PageB-76. Estimated ownership of pu
- Page 194 and 195:
TABLE B-2.—Gross national product
- Page 196 and 197: TABLE B-3.—Implicit price deflato
- Page 198 and 199: TABLE B-4.—Implicit price deflato
- Page 200 and 201: TABLE B~6.—Gross national product
- Page 202 and 203: TABLE B-8.—Gross national product
- Page 204 and 205: TABLE B-9.—Gross national product
- Page 206 and 207: TABLE B-ll.—Gross domestic produc
- Page 208 and 209: TABLE B-13.—Personal consumption
- Page 210 and 211: TABLE B-15.—Inventories and final
- Page 212 and 213: TABLE B-17.—Relation of gross nat
- Page 214 and 215: TABLE B-19.—National income by ty
- Page 216 and 217: TABLE B-20.—Sources of personal i
- Page 218 and 219: TABLE B-21.—Disposition of person
- Page 220 and 221: 19291933Year orquarter1939...194019
- Page 222 and 223: TABLE B~25.- -Number and money inco
- Page 224 and 225: TABLE B-27.—Noninstitutional popu
- Page 226 and 227: TABLE B-28.—Civilian employment a
- Page 228 and 229: TABLE B-30.— Unemployment by dura
- Page 230 and 231: TABLE B-32.—Wage and salary worke
- Page 232 and 233: TABLE B-33.—Average weekly hours
- Page 234 and 235: TABLE B-35.—Productivity and rela
- Page 236 and 237: PRODUCTION AND BUSINESS ACTIVITYTAB
- Page 238 and 239: TABLE B-39.—Industrial production
- Page 240 and 241: TABLE B-41.—New construction acti
- Page 242 and 243: TABLE B-42.—New housing units sta
- Page 244 and 245: TABLE B-44.—Sales and inventories
- Page 248 and 249: TABLE B-48.—Consumer price indexe
- Page 250 and 251: TABLE B—50.—Consumer price inde
- Page 252 and 253: TABLE B-52.—Percent changes in co
- Page 254 and 255: 19291933193919401941194219431944194
- Page 256 and 257: TABLE B-54.—Wholesale price index
- Page 258 and 259: TABLE B-56.—Percent changes in wh
- Page 260 and 261: TABLE B-58.—Commercial bank loans
- Page 262 and 263: TABLE B-60.—Total funds raised in
- Page 264 and 265: TABLE B-61.—Federal Reserve Bank
- Page 266 and 267: TABLE B-63.—Bond yields and inter
- Page 268 and 269: TABLE B-64,—Instalment credit ext
- Page 270 and 271: TABLE B-66.— Mortgage debt outsta
- Page 272 and 273: GOVERNMENT FINANCETABLE B-68.—Fed
- Page 274 and 275: TABLE B-69.—Federal budget receip
- Page 276 and 277: TABLE B-71.—Receipts and expendit
- Page 278 and 279: TABLE B-73.—Receipts and expendit
- Page 280 and 281: TABLE B-75.—Interest-bearing publ
- Page 282 and 283: TABLE B-77.—Average length and ma
- Page 284 and 285: TABLE B-79.—Corporate profits by
- Page 286 and 287: TABLE B—80.—-Corporate profits
- Page 288 and 289: TABLE B1-81.—Sales, profits, and
- Page 290 and 291: TABLE B-83.—Relation of profits a
- Page 292 and 293: TABLE B-85.—Current assets and li
- Page 294 and 295: TABLE B-87.—Common stock prices a
- Page 296 and 297:
192919331939Year orquarter19401941
- Page 298 and 299:
TABLE B-91.—Farm population, empl
- Page 300 and 301:
TABLI. B-93.—Selected measures of
- Page 302 and 303:
INTERNATIONAL STATISTICSTABLE B-95.
- Page 304 and 305:
TABLE B-96.—U.S. merchandise expo
- Page 306 and 307:
TABLE B-98.—U.S. overseas loans a
- Page 308 and 309:
TABLE B-100.—U.S. reserve assets,
- Page 310 and 311:
TABLE B-102.—Price changes in int