

ECONOMIC
Report - The American Presidency Project
Report - The American Presidency Project
- No tags were found...

Create successful ePaper yourself
Turn your PDF publications into a flip-book with our unique Google optimized e-Paper software.
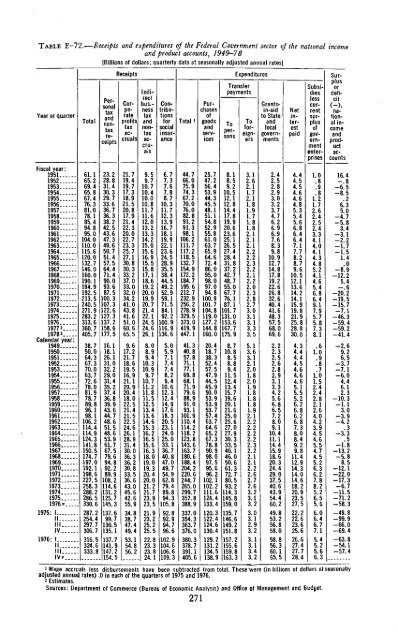
TABLE E-72.—Receipts and expenditures of the Federal Government sector of the national incomeand product accounts, 1949-78[Billions of dollars; quarterly data at seasonally adjusted annual rates]Year or quarterFiscal year:1951195219531954195519561957195819591960196119621963. ..1964196519661967196819691970197119721973.1974197519761977219782Calendar year:19491950195119521953 ....19541955195619571958 . ..1959196019611962196319641965196619671968 ...19691970 ...197119721973197419751976*1975" 1IIIIIIV1976: 1IIIIIIV*____Total61.165.269.465.867.476.381.078.185.494.895.0104.0110.0115.6120.0132.7146.0160.0190.1194.9192.5213.5240.5271.9283.2313.6360.7405.738.750.064.367.370.063.772.678 081.978.789 896.198.1106.2114.4114 9124.3141.8150.5174.7197.0192.1198.6227.5258.3288.2286.5330.6287.2254.4297.7306.7316.5324.6333.823.228.831.430.329.733.636.736.338.242.543.647.349.650.751.457.564.471.490.093.687.500.307.322.627.337.258.677.516.118.126.131.032.229.031.435.237.436.839.943.644.748.651.548.653.961.767.579.694.892.289.9108.2114 6131.2125.7145.3137.699.7130.5135.1137.7141.9147.2154.5Receipts21.719.419.717.318.921.520.817.921.422.320.022.723.325.727.130.830.333.237.033.032.034.241.043.841.651.060.665.59.617.221.718.619.516.921.120.920 418.022.521.421.522.524.626 128.931.430.036.336.230.833.536.643 045.642.655.934.838.747.449.453.154.856.29.59.710.710.410.010.811.711.612.013.213.314.215.015.616.915.515.817.118.619.220.019.920.721.422.124.524.626.18.08.99.410.310.99.710.711.211.811.512.513.413.614.615.316.216.515.616.318.019.019 320.420.021 221.723.923.521.923.225.225.522.823.323.824.16.77.37.67.88.710.311.712.313.916.718.119.922.123.624.528.935.538.444.549.252.959.171.584.192.2100.9116.9136.65.05.97.17.47.48.29.410.612.312.414.917.618.320.523.124.025.033.136.740.847.049.754.962.879.489.894.3105.892.892.994.796.6102.9104.6106.6109.3Total i44.766.075.974.367.270.076.082.891.291.398.1106.2111.7117.2118.5132.7154.9172.2184.7195.6212.7232.9256.2278.9329.5373.0419.9447.141.340.857.871.177.169.868.171.979.688.991.093.1101.9110.4114.2118.2123.8143.6163.7180.6188.4204.2220.6244.7265 0299.7357.8388.9337.0354.3363.7376.0380.3378.7391.1405.6PersonaltaxandnontaxreceiptsCorporateprofitstaxaccrualsIndirectbus;-nesstaxandnontaxaccrualsContributionsforsocialinsurancePurchasesofgoodsandservices25.747.256.453.944.345.548.151.154.852.955.861.063.765.964.672.486.095.098.097.094.8100.9101.7104.8119.0127.2144.8160.020.418.738.352.457.547.944.545.950.053.953.953.757.463.764.665.267.378.890.998.097.595.696.2102.1102.2111.6124.4133.4120.3122.4124.6130.4129.2131.2134.5138.9ExpendituresTransferpaymentsTopersons8.18.59.210.512.112.814.417.819.920.623.625.126.527.428.431.837.242.748.755.067.776.187.1101.7131.0153.6167.7175.98.710.88.58.89.411.512.413 415 719.620.121.625.025.627.027.930.333.540.146.050.661.372.780.593 2114.3145.8159.0135.7146.6149.2151.8157.2155.6159.8163.33.12.62.11.72.11.81.91.71 81.82.12.12.12.22.22.32.22.12.22.02 32.82.73.03.13.13.33.55.13.63.12.12.01.82.01 91 81.81 81.92.12.22.22.22.22.32.22.12.12.22.62.72.63.23.13.23.03.12.93.23.13.13.43.2ToforeignersGrantsin-aidto Stateandlocalgovernments2.42.52.82.93.03.23.74.76.26.96.97.68.39.810.912.714.817.819.222.626 832.640.441.648.357.568.069.62.22.32.52 62.82.93.13.34.25.66.86.57.28.09.110.411.114.415.918.620.324.429.037.540 643.954.460.249.853.256.858.058.856.360.165.5Netinterestpaid4.44 54.54.64.64.85 35.45 66.86.46.47.17.78.28.79.610.512.113.614 214.115.919.821-92 3.82 3.83 3.01.3/ i 41.4\ 51.61 fi4.65 15 55.26 26.86.26.87.38 08.49.29.811.412.914 314.014.618 220.923.527.522.222.623.625.626.627.427.728.41 08.9.81.21 72 62.42 52 43 34.14.04.14.34 85.24.14.65.46 86.49.17.95 75.87.38.1.61 0.98i!o1.52 42 42^82 12.64.04.23.94 54.65.54.74 55.26 36.27.88 25.26.55.66.06.46.77.15.45.25.66.3SubsidieslesscurrentsurplusofgovernmententerprisesSurplusordeficit(-),nationalincomeandproductaccounts16 4— 8-6.5-8.5.26 35 0-4.7—5 83 4-3 1-2.2-1.7-1.51.4.0-8.9-12.25.4-.6—20 2-19.5-15.7-7.1-46 3-59.4-59.2-41.4-2.69 26.5-3 7-7.1-6.04.46 12 3-10.3-1 13.0-3.9-4.2—3! 3.5-1.8-13.2-5.88.5-12.1-22.0-17.3-6.7-11.5-71.2-58.349 8-99.9-66.0-69.4-63.8-54.1-57.4iWage accruals less disbursements have been subtracted from total. These "were (in billions of dollars at seasonallyadjusted annual rates) .0 in each of the quarters of 1975 and 1976.2 Estimates.Sources: Department of Commerce (Bureau of Economic Analysis) and Office of Management and Budget.271


