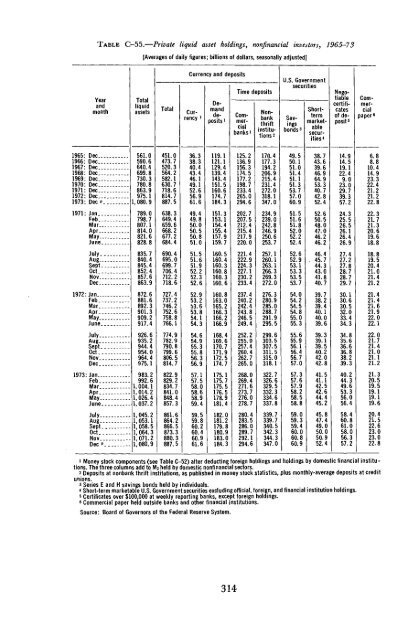
TABLE C—55.—Private liquid asset holdings, nonfinancial investors, 1965—73[Averages of daily figures; billions of dollars, seasonally adjusted]YearandmonthTotalliquidassetsTotalCurrency and depositsCurrency]Demanddeposits*Time depositsCommercialbanks 1Nonbankthriftinstitutions2U.S. GovernmentsecuritiesSavingsbonds 3Shorttermmarketablesecurities«Negotiablecertificatesof deposit*Commercialpaper'1965: Dec.1966: Dec.1967: Dec.1968: Dec.1969: Dec.1970: Dec.1971: Dec.1972: Dec.1973: Dec p.1971: Jan..Feb..Mar..Apr_.May-June.July.Aug_.Sept.Oct..Nov.-Dec.1972:Jan...Feb..Mar..Apr_.May..June.July..Aug..Sept.Oct._Nov..Dec.561.0590.6640.4699.8730.3780.8863.9975.1,080.9789.0798.7807.1814.0821.6828.8835.7840.4845.4852.4857.6863.9872.6881.6892.3901.3909.2917.4926.6935.2944.4954.0964.4975.1451.0473.7520.3564.2582.1630.7718.6814.7887.5638.3649.4659.6668.2677.2684.4690.4695.0699.7706.4712.2718.6727.4737.2746.2752.6758.8766.1774.9782.9790.8799.6806.5814.736.338.340.443.446.149.152.656.961.649.449.850.050.550.851.051.551.651.952.252.352.652.953.2b3.653.854.154.354.654.955.355.856.356.9119.1121.1129.4139.4143.4151.5160.6174.7184.3151.3153.1154.4155.4157.9159.7160.5160.4160.3160.8160.3160.6160.8163.0165.2166.3166.2166.9168.4169.6170.7171.9172.5174.7125.2136.9156.3174.5177.2198.7233.4265.0294.6202.7207.5212.4215.4217.9220.0221.4222.9224.3227.1230.2233.4237.4240.2242.4243.8246.5249.4252.2255.0257.4260.4262.7265.0170.4177.3194.2206.9215.4231.4272.0318.1347.0234.9239.0242.8246.9250.6253.7257.1260.1263.1266.3269.3272.0276.3280.9285.0288.7291.9295.5299.6303.5307.5311.5315.0318.149.550.151.051.451.151.353.757.060.951.551.651.852.052.252.452.652.953.153.353.553.754.054.254.554.855.055.355.655.956.156.456.757.038.743.639.646.964.953.340.742.852.452.650.548.047.046.246.246.445.744.343.041.840.739.738.239.440.140.039.639.339.139.540.242.042.814.914.519.122.49.023.029.739.357.224.325.526.526.126.426.927.427.227.828.728.729.730.130.630.532.033.434.334.835.636.636.838.239.36.88.810.414.923.322.421.221.222.822.321.721.320.619.618.818.819.520.421.021.421.221.421.421.621.922.022.122.021.721.421.021.121.21973:Jan...Feb..Mar..Apr..May..June.983.2992.61,004.11,014.21, 026.41,037.2822.9829.2834.7841.0848.4857.357.157.558.058.658.959.4175.1175.7175.5176.5178.9181.4268.0269.4271.6273.7276.0278.7322.7326.6329.5332.3334.6337.857.357.657.958.258.558.841.541.142.542.644.445.240.244.349.653.356.056.421.320.519.519.119.119.6July...Aug...Sept..Oct...Nov...Dec p .1,045.21,053.11,058.51,064.31,071.21,080.9861.6864.2866.5873.3880.3887.559.559.860.260.460.961.6182.0181.2179.8180.9183.0184.3280.4283.5286.0289.7292.1294.6339.7339.7340.5342.3344.3347.059.059.359.460.060.860.945.847.449.050.050.952.458.460.861.058.056.357.220.421.522.623.023.022.81 Money stock components (see Table C-52) after deducting foreign holdings and holdings by domestic financial institutions.The three columns add to M 2 held by domestic nonfinancial sectors.2 Deposits at nonbank thrift institutions, as published in money stock statistics, plus monthly-average deposits at creditunions.3 Series E and H savings bonds held by individuals.* Short-term marketable U.S. Government securities excluding official, foreign, and financial institution holdings.5 Certificates over $100,000 at weekly reporting banks, except foreign holdings.6 Commercial paper held outside banks and other financial institutions.Source: Board of Governors of the Federal Reserve System.314
TABLE C-56.—Federal Reserve Bank credit and member bank reserves, 1929-73[Averages of daily figures; millions of dollars]Reserve Bank credit outstandingMember bank reservesYear and month*929: Dec1933- Dec . -1939- Dec1940: Dec1941: Dec1942: Dec . . .1943: Dec .-.1944: Dec1945- Dec . . .1946: Dec1947: Dec1948: Dec1949: Dec1950: Dec1951: Dec1952: Dec1953: Dec1954: Dec1955: Dec1956: Dec1957: Dec1958: Dec1959: Dec1960: Dec1961: Dec1962: Dec1963: Dec1964: Dec1965: Dec1966: Dec1967: Dec1968: Dec1969: Dec1970: Dec1971: Dec1972: Dec1973: Dec*1972:Jan . .FebMarAprMayJuneJulyAugSeptOctNovDec1973:JanFebMarAprMayJuneJulyAugSeptOctNovDec pTotal1,6432,6692,6122,3052,4046,03511,91419,61224, 74424, 74622, 85823,97819,01221,60625,44627,29927,10726,31726, 85327,15626,18628,41229, 43529, 06031,21733, 21836,61039, 87343,85346,86451,26856,61064,10066,70874, 25576,85185,55475,41573, 99473,18175,17175, 70576,10877,03576,67675, 45177,33175,95976,85178, 06377,60079, 21980, 54281,88980, 54683, 88082,44581, 80983,64383, 75585,5544462 4322,5102,1882,2195 54911,16618, 69323 70823, 76721,90523, 00218, 28720, 34523,40924, 40025, 63924,91724, 60224, 76523, 98226,31227, 03627, 24829, 09830, 54633, 72937,12640, 88543, 76048, 89152, 52957, 50061,68869,15871,09479,70170, 68769, 96669, 27370, 93971, 42871, 63272, 08971,85870, 25271 35971,11271,09472 19472, 30774 01975,35376,75875, 35577,44876,65376,07378 04278,45779,701Member bankborrowingsTotal801953354902653341572241341181426571,593441246839688710557906871493043272434545572387651,0863211071,0491,298203399109119942024385145746061,0491,1651,5931,8581,7211,7861,7892,0512,1431,8611 4671 3991,298Allother,mainlySeasonal float396142991141804826586547028227298426071,1191,3801,3061,0271,1541,4121,7031,4941,5431,4931,7251,9702,3682,5542,5042,5142,5472,1393,3165,5144,6994,9904,70841 4,5554,7083,9953,8094,1234,1584,3824,7444,3804,6855 3984,2414,7084 7043,7003 3425 3 46830 3,34577 3,402124 4,381163 3,649147 3,875126 4 13484 3 89941 4,555Total2,3952 58811,47314, 04912,81213,15212, 74914,16816 02716,51717,26119,99016,29117,39120,31021,18019,92019, 27919,24019, 53519,42018,8992 18,93219,28320,11820, 04020, 74621,60922, 71923, 83025, 26027, 22128, 03129, 26531,3293 31,3533 34,98432, 86531,92231,92132, 56532,81232, 53933, 02133,14833, 00333 8033 31,77431,3533 32,96231,74231 97332,27732, 39332, 02833,54233, 78534,01934,91234, 72734,984U.S.GovernmentsecuritiesRequired2,347U 8226,4627,4039,42210 77611,70112, 88414 53615,61716,27519,19315,48816,36419, 48420, 45719,22718, 57618,64618,88318, 84318, 38318, 45018, 52719, 55019,46820,21021,19822, 26723, 43824,91526, 76627, 77428,99331,16431,13434,79132,69231,79831,68832, 42932, 70832, 33532, 87432,89332,84133 55631,46031,13432,62031, 53731,67832,12532, 27531,96933,19933,53933,78234,71234, 52334,791Excess48I 7665,0116 6463,3902 3761 0481 2841 491'9009867978031 0278267236937035946525775164827565685725364114523923454552572721653 2193 1931731242331361042041472551622473 3142193 342205295152118593432462372002041931 Data are for licensed banks only.2 Beginning December 1959, total reserves held include vault cash allowed.3 Beginning November 1972, includes $450 million of reserve deficiencies on which Federal Reserve Banks are allowedto waive penalties for a transition period in connection with bank adaptation to Regulation J as amended effective November9,1972. Beginning 1973, allowable deficiencies included are (beginning with first statement week of quarter): firstquarter, $279 million; second quarter, $172 million; third quarter, $112 million; fourth quarter, $84 mifiion.Source: Board of Governors of the Federal Reserve System.315
- Page 1:
ECONOMICTRANSMITTEDTO THE CONGRESSF
- Page 5:
CONTENTSPageECONOMIC REPORT OF THE
- Page 9 and 10:
ECONOMIC REPORT OF THE PRESIDENTTo
- Page 11 and 12:
of the inflation rate of 1973, and
- Page 13:
or permit incentives—including hi
- Page 16 and 17:
people of an easy time. Like our pa
- Page 19:
THE PRESIDENT:LETTER OF TRANSMITTAL
- Page 22 and 23:
CHAPTER 3. INFLATION CONTROL UNDER
- Page 24 and 25:
Page7. Unemployment Rates by Sex an
- Page 26 and 27:
Page53. Maximum Percent Change in E
- Page 28 and 29:
We have specific problems, too, asi
- Page 30 and 31:
This curtailment of supply does, of
- Page 32 and 33:
consumption we would not have chose
- Page 34 and 35:
outside the food and fuel sectors a
- Page 36 and 37:
about $14 billion from deficit to s
- Page 38 and 39:
8 percent, at annual rates. Continu
- Page 40 and 41:
A third method, which seems to have
- Page 42 and 43:
DEVELOPMENT OF LOW-COST ENERGY FOR
- Page 44 and 45:
would otherwise have been invested
- Page 46 and 47:
TRANSPORTATION REFORMLast year the
- Page 48 and 49:
constraints. Restrictions on entry
- Page 50 and 51:
In early 1974 the Commerce Departme
- Page 52 and 53:
Consumer SpendingConsumer expenditu
- Page 54 and 55:
Chart 1Changes in GNP, Real GNP, GN
- Page 56 and 57:
During the fourth quarter the downt
- Page 58 and 59:
A number of points may be noted abo
- Page 60 and 61:
income do not appear to have played
- Page 62 and 63:
Chart 2Changes in Real GNPPERCENTUN
- Page 64 and 65:
of essentially declining participat
- Page 66 and 67:
The unemployment rate for adult mal
- Page 68 and 69:
from job losers, the remainder of t
- Page 70 and 71:
to maintain a somewhat larger work
- Page 72 and 73:
Chart 3Changes in Selected Price Me
- Page 74 and 75:
TABLE 12.—Changes in selected pri
- Page 76 and 77:
production workers, and it is sensi
- Page 78 and 79:
the profits that companies report a
- Page 80 and 81:
Two measures of changes in income t
- Page 82 and 83:
About $8 billion of the growth in e
- Page 84 and 85:
effect of covered wage and employme
- Page 86 and 87:
Since these apparent stabilization
- Page 88 and 89:
MONETARY POLICY AND FINANCIAL MARKE
- Page 90 and 91:
lation requiring ceilings on all CD
- Page 92 and 93:
TABLE 19.—Offerings of new securi
- Page 94 and 95:
CHAPTER 3Inflation Control Under th
- Page 96 and 97:
(A more detailed presentation of th
- Page 98 and 99:
ate of advance in grocery store foo
- Page 100 and 101:
to the economy but also in the sens
- Page 102 and 103:
were imposed, limiting prices to th
- Page 104 and 105:
spurring of domestic inflation by e
- Page 106 and 107:
was more than twice as high in 1973
- Page 108 and 109:
wage increases in many cases, const
- Page 110 and 111:
TABLE 26.—Behavior of items in co
- Page 112 and 113:
Chart 6Changes in RelatedWholesale
- Page 114 and 115:
and natural gas. A complex set of f
- Page 116 and 117:
CHAPTER 4Energy and AgricultureFOR
- Page 118 and 119:
al gas have contributed to the low
- Page 120 and 121:
TABLE 30*—Wholesale prices, all i
- Page 122 and 123:
tion sector, which in 1972 accounte
- Page 124 and 125:
United States on oil imports, OPEC
- Page 126 and 127:
of old oil and prices of imported a
- Page 128 and 129:
LONG-TERM PROSPECTSThe price of imp
- Page 130 and 131:
important that the higher costs be
- Page 132 and 133:
improving the environment. The fund
- Page 134 and 135:
pollutants into the atmosphere will
- Page 136 and 137:
of research and rapid mechanization
- Page 138 and 139:
lion in fiscal 1972. Actually the a
- Page 140 and 141:
a minimum income. Unless prices fal
- Page 142 and 143:
The Administration supports the exa
- Page 144 and 145:
and estimates of some of these effe
- Page 146 and 147:
Since families typically pool their
- Page 148 and 149:
ability were not perfectly correlat
- Page 150 and 151:
Farm wages and farm income received
- Page 152 and 153:
TABLE 37.—Average usual weekly ea
- Page 154 and 155:
Chart 9Real Incomes for Men in Diff
- Page 156 and 157:
ecause they have acquired more expe
- Page 158 and 159:
whose owners or white workers have
- Page 160 and 161:
Several factors can be mentioned to
- Page 162 and 163:
y social pressures, however, which
- Page 164 and 165:
TABLE 42.—Relation of wage and sa
- Page 166 and 167:
ferences in their mix of occupation
- Page 168 and 169:
for public housing may be valued by
- Page 170 and 171:
8 to 20 percent for black females.
- Page 172 and 173:
sufficiently high to cover the addi
- Page 174 and 175:
TABLE 45.—Federal Government tran
- Page 176 and 177:
given to the problems of poverty du
- Page 178 and 179:
TABLE 47.—Trends in the employmen
- Page 180 and 181:
enefit increases greater than the i
- Page 182 and 183:
(Table 45). Medicare is chiefly des
- Page 184 and 185:
Public assistance is specifically d
- Page 186 and 187:
Then, subtracting equation (4) from
- Page 188 and 189:
policies, and the tensions among co
- Page 190 and 191:
In the fourth quarter the dollar ro
- Page 192 and 193:
which include trade, grants and oth
- Page 194 and 195:
tarily by foreign central banks, ev
- Page 196 and 197:
ply of oil, and by domestic price c
- Page 198 and 199:
in the United States. In view of th
- Page 200 and 201:
TABLE 52.—U.S. balances on intern
- Page 202 and 203:
esult from changes in market value
- Page 204 and 205:
TABLE 54.—Major changes in capita
- Page 206 and 207:
attempt was made to agree on a code
- Page 208 and 209:
The official price of gold was rais
- Page 210 and 211:
system, these demand changes were a
- Page 212 and 213:
What Pressures Should Be Exerted on
- Page 214 and 215:
The composition of reserves among d
- Page 216 and 217:
prices of approximately the same or
- Page 218 and 219:
tained, they would probably be felt
- Page 220 and 221:
Reducing Nontariff BarriersIn order
- Page 222 and 223:
Structural problems. Agreements on
- Page 224 and 225:
arrangements which are designed to
- Page 226 and 227:
capital and the means of putting th
- Page 228 and 229:
Canada and four smaller countries u
- Page 230 and 231:
currencies have appreciated relativ
- Page 232 and 233:
Effective Changes in Other Currenci
- Page 235 and 236:
Activities of the Advisory Committe
- Page 237:
Appendix BREPORT TO THE PRESIDENT O
- Page 241 and 242:
Report to the President on the Acti
- Page 243 and 244:
govern the exploitation of the reso
- Page 245 and 246:
Manpower and Social Affairs Committ
- Page 247 and 248:
Junior Staff EconomistsJames S. Fac
- Page 249:
Appendix CSTATISTICAL TABLES RELATI
- Page 252 and 253:
PRODUCTION AND BUSINESS ACTIVITY:Pa
- Page 255 and 256:
NATIONAL INCOME OR EXPENDITURETABLE
- Page 257 and 258:
TABLE C-2.—Gross national product
- Page 259 and 260:
TABLE C-3.—Implicit price deflato
- Page 261 and 262:
TABLE C-5.—Gross national product
- Page 263 and 264:
TABLE C-7.—Gross national product
- Page 265 and 266:
TABLE C—8.—Gross national produ
- Page 267 and 268:
TABLE C-10.—Gross national produc
- Page 269 and 270: TABLE C-12.—Personal consumption
- Page 271 and 272: TABLE C-14.—Relation of gross nat
- Page 273 and 274: TABLE C—16.—Relation of nationa
- Page 275 and 276: TABLE C-18.— Total and per capita
- Page 277 and 278: TABLE C-19.—Sources of personal i
- Page 279 and 280: TABLE C-21.—Saving by individuals
- Page 281 and 282: POPULATION, EMPLOYMENT, WAGES, ANDP
- Page 283 and 284: TABLE C-24.—Noninstitutional popu
- Page 285 and 286: TABLE C-26.— Selected unemploymen
- Page 287 and 288: TABLE C—28.—Unemployment insura
- Page 289 and 290: TABLE C-29.—Wage and salary worke
- Page 291 and 292: TABLE C-31.—.•Average weekly ea
- Page 293 and 294: TABLE C-33.—Changes in output per
- Page 295 and 296: TABLE C—35.—Industrial producti
- Page 297 and 298: TABLE C-37.—Capacity utilization
- Page 299 and 300: TABLE C—38.—New construction ac
- Page 301 and 302: TABLE C-39.—New housing starts an
- Page 303 and 304: TABLE C-41.—Sales and inventories
- Page 305 and 306: TABLE C-43.—Manvjacturers* new an
- Page 307 and 308: TABLE O45.—Consumer price indexes
- Page 309 and 310: TABLE C—47.—Consumer price inde
- Page 311 and 312: TABLE C~49.—Wholesale price index
- Page 313 and 314: TABLE C-50.—Wholesale price index
- Page 315 and 316: 194819491950.,1951195219531954Yearo
- Page 317 and 318: TABLE C-53.—Commercial bank loans
- Page 319: TABLE G-54.—Total funds raised in
- Page 323 and 324: TABLE C-58.—Bond yields and inter
- Page 325 and 326: TABLE C-59.—Short- and intermedia
- Page 327 and 328: TABLE C-61.—Mortgage debt outstan
- Page 329 and 330: TABLE C-63.—Net public and privat
- Page 331 and 332: TABLE C-65.—Federal budget receip
- Page 333 and 334: TABLE C-66.—Relation of the Feder
- Page 335 and 336: TABLE C-68.—Receipts and expendit
- Page 337 and 338: TABLE C-10.—State and local gover
- Page 339 and 340: TABLE C-72.—Estimated ownership o
- Page 341 and 342: CORPORATE PROFITS AND FINANCETABLE
- Page 343 and 344: TABLE C-76.—Relation of profits a
- Page 345 and 346: TABLE C-77.—Sources and uses of f
- Page 347 and 348: TABLE C-79.—State and municipal a
- Page 349 and 350: TABLE C-81.—Business formation an
- Page 351 and 352: Year1929...1933...1939...1940...194
- Page 353 and 354: TABLE C-85.—Indexes of prices rec
- Page 355 and 356: TABLE G-87.—Comparative balance s
- Page 357 and 358: TABLE G-88.— U.S. balance of paym
- Page 359 and 360: TABLE C-90.— U.S. merchandise exp
- Page 361 and 362: TABLE C-92.—International reserve
- Page 363 and 364: TABLE G-94.—International investm
- Page 365: TABLE C-96.—Consumer price indexe