- Page 1:
ECONOMICTRANSMITTEDTO THE CONGRESSF
- Page 5: CONTENTSPageECONOMIC REPORT OF THE
- Page 9 and 10: ECONOMIC REPORT OF THE PRESIDENTTo
- Page 11 and 12: of the inflation rate of 1973, and
- Page 13: or permit incentives—including hi
- Page 16 and 17: people of an easy time. Like our pa
- Page 19: THE PRESIDENT:LETTER OF TRANSMITTAL
- Page 22 and 23: CHAPTER 3. INFLATION CONTROL UNDER
- Page 24 and 25: Page7. Unemployment Rates by Sex an
- Page 26 and 27: Page53. Maximum Percent Change in E
- Page 28 and 29: We have specific problems, too, asi
- Page 30 and 31: This curtailment of supply does, of
- Page 32 and 33: consumption we would not have chose
- Page 34 and 35: outside the food and fuel sectors a
- Page 36 and 37: about $14 billion from deficit to s
- Page 38 and 39: 8 percent, at annual rates. Continu
- Page 40 and 41: A third method, which seems to have
- Page 42 and 43: DEVELOPMENT OF LOW-COST ENERGY FOR
- Page 44 and 45: would otherwise have been invested
- Page 46 and 47: TRANSPORTATION REFORMLast year the
- Page 48 and 49: constraints. Restrictions on entry
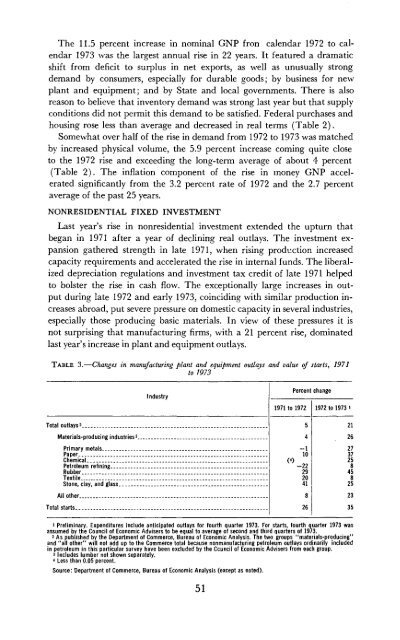
- Page 50 and 51: In early 1974 the Commerce Departme
- Page 52 and 53: Consumer SpendingConsumer expenditu
- Page 54 and 55: Chart 1Changes in GNP, Real GNP, GN
- Page 58 and 59: A number of points may be noted abo
- Page 60 and 61: income do not appear to have played
- Page 62 and 63: Chart 2Changes in Real GNPPERCENTUN
- Page 64 and 65: of essentially declining participat
- Page 66 and 67: The unemployment rate for adult mal
- Page 68 and 69: from job losers, the remainder of t
- Page 70 and 71: to maintain a somewhat larger work
- Page 72 and 73: Chart 3Changes in Selected Price Me
- Page 74 and 75: TABLE 12.—Changes in selected pri
- Page 76 and 77: production workers, and it is sensi
- Page 78 and 79: the profits that companies report a
- Page 80 and 81: Two measures of changes in income t
- Page 82 and 83: About $8 billion of the growth in e
- Page 84 and 85: effect of covered wage and employme
- Page 86 and 87: Since these apparent stabilization
- Page 88 and 89: MONETARY POLICY AND FINANCIAL MARKE
- Page 90 and 91: lation requiring ceilings on all CD
- Page 92 and 93: TABLE 19.—Offerings of new securi
- Page 94 and 95: CHAPTER 3Inflation Control Under th
- Page 96 and 97: (A more detailed presentation of th
- Page 98 and 99: ate of advance in grocery store foo
- Page 100 and 101: to the economy but also in the sens
- Page 102 and 103: were imposed, limiting prices to th
- Page 104 and 105: spurring of domestic inflation by e
- Page 106 and 107:
was more than twice as high in 1973
- Page 108 and 109:
wage increases in many cases, const
- Page 110 and 111:
TABLE 26.—Behavior of items in co
- Page 112 and 113:
Chart 6Changes in RelatedWholesale
- Page 114 and 115:
and natural gas. A complex set of f
- Page 116 and 117:
CHAPTER 4Energy and AgricultureFOR
- Page 118 and 119:
al gas have contributed to the low
- Page 120 and 121:
TABLE 30*—Wholesale prices, all i
- Page 122 and 123:
tion sector, which in 1972 accounte
- Page 124 and 125:
United States on oil imports, OPEC
- Page 126 and 127:
of old oil and prices of imported a
- Page 128 and 129:
LONG-TERM PROSPECTSThe price of imp
- Page 130 and 131:
important that the higher costs be
- Page 132 and 133:
improving the environment. The fund
- Page 134 and 135:
pollutants into the atmosphere will
- Page 136 and 137:
of research and rapid mechanization
- Page 138 and 139:
lion in fiscal 1972. Actually the a
- Page 140 and 141:
a minimum income. Unless prices fal
- Page 142 and 143:
The Administration supports the exa
- Page 144 and 145:
and estimates of some of these effe
- Page 146 and 147:
Since families typically pool their
- Page 148 and 149:
ability were not perfectly correlat
- Page 150 and 151:
Farm wages and farm income received
- Page 152 and 153:
TABLE 37.—Average usual weekly ea
- Page 154 and 155:
Chart 9Real Incomes for Men in Diff
- Page 156 and 157:
ecause they have acquired more expe
- Page 158 and 159:
whose owners or white workers have
- Page 160 and 161:
Several factors can be mentioned to
- Page 162 and 163:
y social pressures, however, which
- Page 164 and 165:
TABLE 42.—Relation of wage and sa
- Page 166 and 167:
ferences in their mix of occupation
- Page 168 and 169:
for public housing may be valued by
- Page 170 and 171:
8 to 20 percent for black females.
- Page 172 and 173:
sufficiently high to cover the addi
- Page 174 and 175:
TABLE 45.—Federal Government tran
- Page 176 and 177:
given to the problems of poverty du
- Page 178 and 179:
TABLE 47.—Trends in the employmen
- Page 180 and 181:
enefit increases greater than the i
- Page 182 and 183:
(Table 45). Medicare is chiefly des
- Page 184 and 185:
Public assistance is specifically d
- Page 186 and 187:
Then, subtracting equation (4) from
- Page 188 and 189:
policies, and the tensions among co
- Page 190 and 191:
In the fourth quarter the dollar ro
- Page 192 and 193:
which include trade, grants and oth
- Page 194 and 195:
tarily by foreign central banks, ev
- Page 196 and 197:
ply of oil, and by domestic price c
- Page 198 and 199:
in the United States. In view of th
- Page 200 and 201:
TABLE 52.—U.S. balances on intern
- Page 202 and 203:
esult from changes in market value
- Page 204 and 205:
TABLE 54.—Major changes in capita
- Page 206 and 207:
attempt was made to agree on a code
- Page 208 and 209:
The official price of gold was rais
- Page 210 and 211:
system, these demand changes were a
- Page 212 and 213:
What Pressures Should Be Exerted on
- Page 214 and 215:
The composition of reserves among d
- Page 216 and 217:
prices of approximately the same or
- Page 218 and 219:
tained, they would probably be felt
- Page 220 and 221:
Reducing Nontariff BarriersIn order
- Page 222 and 223:
Structural problems. Agreements on
- Page 224 and 225:
arrangements which are designed to
- Page 226 and 227:
capital and the means of putting th
- Page 228 and 229:
Canada and four smaller countries u
- Page 230 and 231:
currencies have appreciated relativ
- Page 232 and 233:
Effective Changes in Other Currenci
- Page 235 and 236:
Activities of the Advisory Committe
- Page 237:
Appendix BREPORT TO THE PRESIDENT O
- Page 241 and 242:
Report to the President on the Acti
- Page 243 and 244:
govern the exploitation of the reso
- Page 245 and 246:
Manpower and Social Affairs Committ
- Page 247 and 248:
Junior Staff EconomistsJames S. Fac
- Page 249:
Appendix CSTATISTICAL TABLES RELATI
- Page 252 and 253:
PRODUCTION AND BUSINESS ACTIVITY:Pa
- Page 255 and 256:
NATIONAL INCOME OR EXPENDITURETABLE
- Page 257 and 258:
TABLE C-2.—Gross national product
- Page 259 and 260:
TABLE C-3.—Implicit price deflato
- Page 261 and 262:
TABLE C-5.—Gross national product
- Page 263 and 264:
TABLE C-7.—Gross national product
- Page 265 and 266:
TABLE C—8.—Gross national produ
- Page 267 and 268:
TABLE C-10.—Gross national produc
- Page 269 and 270:
TABLE C-12.—Personal consumption
- Page 271 and 272:
TABLE C-14.—Relation of gross nat
- Page 273 and 274:
TABLE C—16.—Relation of nationa
- Page 275 and 276:
TABLE C-18.— Total and per capita
- Page 277 and 278:
TABLE C-19.—Sources of personal i
- Page 279 and 280:
TABLE C-21.—Saving by individuals
- Page 281 and 282:
POPULATION, EMPLOYMENT, WAGES, ANDP
- Page 283 and 284:
TABLE C-24.—Noninstitutional popu
- Page 285 and 286:
TABLE C-26.— Selected unemploymen
- Page 287 and 288:
TABLE C—28.—Unemployment insura
- Page 289 and 290:
TABLE C-29.—Wage and salary worke
- Page 291 and 292:
TABLE C-31.—.•Average weekly ea
- Page 293 and 294:
TABLE C-33.—Changes in output per
- Page 295 and 296:
TABLE C—35.—Industrial producti
- Page 297 and 298:
TABLE C-37.—Capacity utilization
- Page 299 and 300:
TABLE C—38.—New construction ac
- Page 301 and 302:
TABLE C-39.—New housing starts an
- Page 303 and 304:
TABLE C-41.—Sales and inventories
- Page 305 and 306:
TABLE C-43.—Manvjacturers* new an
- Page 307 and 308:
TABLE O45.—Consumer price indexes
- Page 309 and 310:
TABLE C—47.—Consumer price inde
- Page 311 and 312:
TABLE C~49.—Wholesale price index
- Page 313 and 314:
TABLE C-50.—Wholesale price index
- Page 315 and 316:
194819491950.,1951195219531954Yearo
- Page 317 and 318:
TABLE C-53.—Commercial bank loans
- Page 319 and 320:
TABLE G-54.—Total funds raised in
- Page 321 and 322:
TABLE C-56.—Federal Reserve Bank
- Page 323 and 324:
TABLE C-58.—Bond yields and inter
- Page 325 and 326:
TABLE C-59.—Short- and intermedia
- Page 327 and 328:
TABLE C-61.—Mortgage debt outstan
- Page 329 and 330:
TABLE C-63.—Net public and privat
- Page 331 and 332:
TABLE C-65.—Federal budget receip
- Page 333 and 334:
TABLE C-66.—Relation of the Feder
- Page 335 and 336:
TABLE C-68.—Receipts and expendit
- Page 337 and 338:
TABLE C-10.—State and local gover
- Page 339 and 340:
TABLE C-72.—Estimated ownership o
- Page 341 and 342:
CORPORATE PROFITS AND FINANCETABLE
- Page 343 and 344:
TABLE C-76.—Relation of profits a
- Page 345 and 346:
TABLE C-77.—Sources and uses of f
- Page 347 and 348:
TABLE C-79.—State and municipal a
- Page 349 and 350:
TABLE C-81.—Business formation an
- Page 351 and 352:
Year1929...1933...1939...1940...194
- Page 353 and 354:
TABLE C-85.—Indexes of prices rec
- Page 355 and 356:
TABLE G-87.—Comparative balance s
- Page 357 and 358:
TABLE G-88.— U.S. balance of paym
- Page 359 and 360:
TABLE C-90.— U.S. merchandise exp
- Page 361 and 362:
TABLE C-92.—International reserve
- Page 363 and 364:
TABLE G-94.—International investm
- Page 365:
TABLE C-96.—Consumer price indexe