


You also want an ePaper? Increase the reach of your titles
YUMPU automatically turns print PDFs into web optimized ePapers that Google loves.
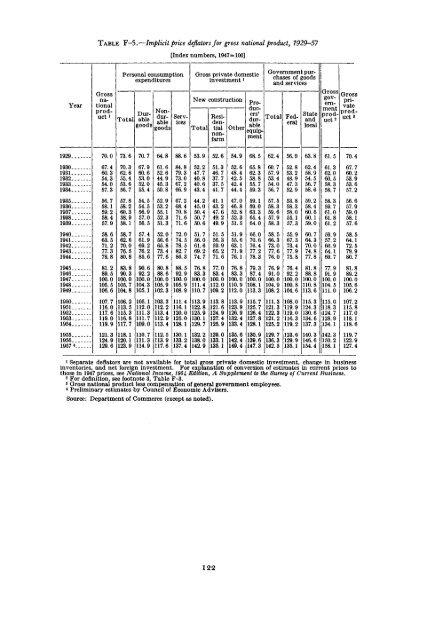
TABLE F—5.—Implicit price deflators for gross national product, 1929—57[Index numbers, 1947=100]1929193019311932193319341935193619371938193919401941194219431944Year19451946194719481949 -.19501951195219531954195519561957 «Grossnationalproducti70.067.460.354.354.057.356.758.159.258.457.958.663.571.277.378.881.289.5100.0105.5106.6107.7116.0117.6119.0119.9121.3124.9129.6Personal consumptionexpenditures73.670.362.655.453.656.757.858.260.358.958.158.762.670.076.580.883.890.3100.0105.7104.8106.2113.5115.3116.8117.7118.1120.1123.970.767.960.653.052.055.454.554.556.957.056.557.461.969.276.285.690.692.2100.0104.3105.1105.1112.0111.3111.7109.0110.7111.3114.964.861.652.644.945.350.852.953.255.152.351.352.056.665.873.477.680.888.6100.0105.9102.3103.3112.2113.4112.9113.4112.5113.9117.688.684.879.373.067.266.967.268.470.871.671.672.074.578.582.786.388.592.9100.0105.9108.9111.4116.1120.0125.0128.1130.1133.2137.4Gross private domesticinvestment 1DurableNon-Totaldur-ablegoodsgoodsServicesNew construction Producers'Residentiaabledur-TotalTotal Othernonfarmequipment53.952.247.740.840.643.444.245.050.450.750.651.756.061.669.274.776.883.3100.0111.4110.7113.9122.8125.9130.1129.7132.2138.0142.952.651.346.737.737.541.741.143.247.649.249.951.556.359.965.271.677.083.4100.0112.0109.2113.8121.6124.9127.4125.9129.0133.1135.154.952.648.442.542.444.447.046.852.852.351.551.955.663.171.976.176.883.3100.0110.9112.0113.9123.9126.9132.4133.4135.6142.4149.468.565.862.358.855.759.359.159.063.365.464.066.070.676.477.278.379.387.4100.0108.1113.3115.7125.7126.4127.8128.1130.9139.6147.3Government purchasesof goodsand services62.460.757.953.454.056.757.558.359.657.958.358.566.373.077.676.076.991.0100.0104.9108.2111.3121.3122.3121.2125.2129.7136.3142.5Federal56.052.853.248.947.352.953.858.358.055.157.355.967.373.477.975.876.492.2100.0100.8104.6108.0119.9119.0116.3119.2123.6129.9135.1Stateandlocal63.862.458.954.556.758.659.258.460.660.159.060.764.370.074.877.881.888.8100.0110.8113.6115.3124.3130.6134.6137.3140.3146.6154.4Grossgovernmentproduct261.561.362.060.558.358.758.359.761.061.861.259.957.260.964.169.777.991.9100.0104.5111.0115.0118.3|124. 7!128. 9134.1142.3150.2158.1Grossprivateproduct370.467.760.253.953.657.256.657.959.058.157.658.564.172.579.980.781.889.2100.0105.6106.2107.2115.8117.0118.1118.6119.7122.9127.41 Separate deflators are not available for total gross private domestic investment, change in businessinventories, and net foreign investment. For explanation of conversion of estimates in current prices tothose in 1947 prices, see National Income, 1954. Edition, A Supplement to the Survey of Current Business.2 For definition, see footnote 3, Table F-3.3 Gross national product less compensation of general government employees.4 Preliminary estimates by Council of Economic Advisers.Source: Department of Commerce (except as noted).122


