


You also want an ePaper? Increase the reach of your titles
YUMPU automatically turns print PDFs into web optimized ePapers that Google loves.
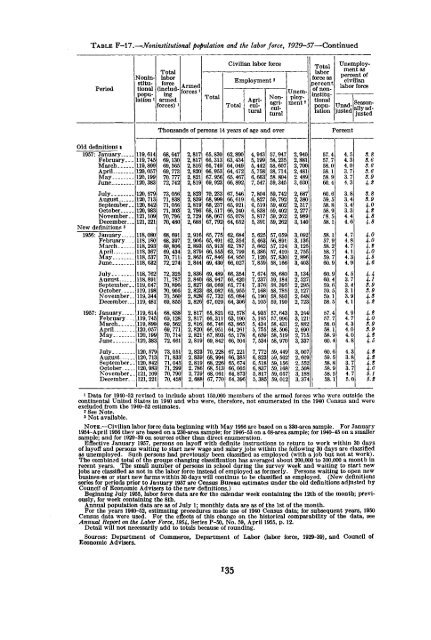
TABLE F-17.—Noninstitutional population and the labor force,1929-57—ContinuedPeriodSloninstitutionalpopuationlTotallaborforce(includingarmedforces)Armedforces *TotalCivilian labor forceTotalEmployment 2AgriculturalNonagriculturalUnemployment2Totallaborforce aspercentof noninstitutionalpopulationUnemploymentaspercent ofcivilianlabor forceUnadjustedSeasonallyadjustedThousands of persons 14 years of age and overPercentOld definitions t1957: JanuaryFebruary._.MarchAprilMayJune..JulyAugustSeptember.OctoberNovember.December..New definitions 21956: JanuaryFebruaryMarchAprilMayJuneJulyAugustSeptember.OctoberNovember.December..1957: JanuaryFebruary ..MarchAprilMayJuneJulyAugustSeptember.October...November.December.119,614119, 745119,899120,057120,199120,383120, 579120, 713120,842120,983121,109121, 221118,080118,180118, 293118,367118, 537118,632118, 762118,891119,047119,198119,344119, 481119,614119,745119,899120,057120,199120,383120, 579120, 713120,842120,983121,109121,22168,64769,13069, 56569, 77370. 77772, 74273, 05671,83871,05671,30370,79670, 48068,69168,39768,80669, 43470, 71172,27472,32571, 78770,89670,90570, 56069, 85568,63869,12869, 56269, 77170, 71472, 66173,05171,83371,04571,29970, 79070,4582,8172,8172,8162,8202,8212,8192,8232,8392,8192,7862,7292,6882,9162,9062,8932,8792,8652,8442,8362,8402,8272,8232,8282,8262,8172,8172,8162,8202,8212,8192,8232.8392,8192,7862,7292,68865,83066, 31366, 74966,95367. 95669,92370,23368,99968,23768,51768,06767,79265, 77565,49165, 91366, 55567,84669, 43069,48968,94768,06968,08267, 73267,02965,82166,31166, 74666,95167,89369, 84270,22868,99468,22668,51368,06167, 77062,89063,43464,04964, 47265, 46766,89267, 54666, 61965, 92166,24065,07864,65262,68462,35462, 78763,79964,95066,02766,35466, 42065, 77465, 95565,08464,30662, 57863,19063.86564. 26165,17866,50467,22166, 38565, 67466,00564,87364,3964,9435,1995,4425,7586,6637,5477,8046,8276,5196,8385,8175,3915,6255,4635,6626,3867,1207,8597,6747,2377,3767,1686,1905,1054,9355,1955,4345,7556,6597,5347,7726,823G, 5186,8375,8175,38557,94758, 23558,60758, 71458. 80459,34559, 74259, 79259, 40259, 40259, 26259,26257,05956,89157,12457, 41057,83058,16658, 68059,18458,39558, 78558, 89359,19957, 64357,99658, 43158,50658, 51958,97059, 44959, 56259,15659,16859,05759,0122,9402,8812,7002,4812.4893,0302,6872,3802,31"2,27'2,9893,1403,0923,1363,1252,7552,8963,4033,1342,5272,2952,1272,6482,7233,2443,12'2,8822,6902,7153,3373,0072,6092,5522,5083,1853,37'57.457.758.058.158.960.460.659.558.858.9f8.558.158.157.958.258.759.760.960.960.459.659. 559.158.567.457.758.058.158.960.460.659.558.858.958.558.14.5 3.84.3 S.64.0 S.63. 7 S.63. 73 S.94. 4.23.8 S.83. 4 S.93. 4 4.03. 3 4.24. 46 4-84. 4.84. 7 4.04. 87139 4.04. 4.24. 4.04 4.54 4.64 5 4-43 7 4.13 4 S.93.1 S.93.9 4.S4.1 4.24 9 4.24 73 4.04 S.9444 0 S.908 4.24.54 3 4.23^8 4.23 4.S345 7 4.670 5.15.21 Data for 1910-52 revised to include about 150,000 members of the armed forces who were outside thecontinental United States in 1940 and who were, therefore, not enumerated in the 1940 Census and wereexcluded from the 1940-52 estimates.2 See Note.3 Not available.NOTE.—Civilian labor force data beginning with May 1956 are based on a 330-area sample. For January1954-April 1956 thev are based on a 230-area sample; for 1946-53 on a 68-area sample; for 1940-45 on a smallersample; and for 1929-39 on sources other than direct enumeration.Effective January 1957, persons on layoff with definite instructions to return to work within 30 daysof layoff and persons waiting to start new wage and salary jobs within the following 30 days are classifiedas unemployed. Such persons had previously been classified as employed (with a job but not at work).The combined total of the groups changing classification has averaged about 200,000 to 300,000 a month inrecent years. The small number of persons in school during the survey week and waiting to start newjobs are classified as not in the labor force instead of employed as formerly. Persons waiting to open newbusinesi-es or start new farms within 30 days will continue to be classified as employed. (New definitionsseries for periods prior to January 1957 are Census Bureau estimates under the old definitions adjusted byCouncil of Economic Advisers to the new definitions.)Beginning July 1955, labor force data are for the calendar week containing the 12th of the month; previously,for week containing the 8th.Annual population data are as of July 1; monthly data are as of the 1st of the month.For the years 1940-52, estimating procedures made use of 1940 Census data; for subsequent years, 1950Census data were used. For the effects of this change on the historical comparability of the data, seeAnnual Report on the Labor Force, 1954, Series P-50, No. 59, April 1955, p. 12.Detail will not necessarily add to totals because of rounding.Sources: Department of Commerce, Department of Labor (labor force, 1929-39), and Council ofEconomic Advisers.135


