TABLE F—18.—Employment and unemployment, by age and sex, 1942—57[Thousands of persons 14 years of age and over]PeriodTotalcivilianlaborforce14-19yearsEmployed20-44 yearsMale45 yearsand overMaleTotalemployedFemaleFemale14-19yearsUnemployed20-44 yearsMale45 yearsand overMaleTotalunemployedFemaleFemaleOld definitions *19421943194456,41055, 54054, 63053,75054,47053, 9605,770 20,790 9,40014,1606,35017,55011,05015,1606, 050 16, 380 11, 280 15, 4803,6304,3604,7702,6601,0706705102902006701801405202601707702401101901005019451946 _'___19471948194953,86057,52060,16861, 44262,10552, 82055, 25058, 02759, 37858, 7105,480 15, \, 830 11,140 15, 5204, 1704, 717 23; C4094, 841 23, i, 842 10,098 15, 6774,, 512 23, 1,483 10,087 15, 4914,8504,3804,6004,9245,1381,0402,2702,1422,0643, 39f1902904254155953301,2009207571,329270280303353559200410396414719509099127194195019511952195319541955195663,09962,88462,96663,81564,46859, 95761, 00561,29362, 21361, 238564 23, 833 10, 376 15, 666 5,517614 23, 594 10, 833 16,144 5,819530 23, 372 10,917 16, 345 6,130514 23, 715 10, 953 16, 725 6,306285 23,178 10, 730 16, 649 6,39565,847 63,193 4,446 23,76811,00016,87867, 530 64,979 4, 764 24, 05111, 271 17,2947,1017,5983,1421,8791,6731,6023,2302,6542,5515433563623125154715101,1195154955121,158854784552419344300617502491697402345363606530232190127116256222239New definitions i195767, 946 65, 011 4, 720 23,993 11, 247 17, 2467,8042,936574935566606255Old definitions i1956: January...February .March .. .AprilMayJune65, 77565, 49065, 91366, 55567, 84669, 43062, 89162, 57663, 07863,99065, 23866, 5034, 020 23, 685 10, 962 16, i, 9203,870 23,' 964 16, 8483, 917 23, 759 10, 926 17, .0334,205 23,' 050 17, 2584,565 23,99311,47217, ',4215, 813 24, 288 11, 341 17, 4847,3057,2467.44'7,5687,7887,5782,8852,9142,8342,5642,6082,9274425084334135481,005967947977836769788581462495459490469713783675565536421184215255289265241JulyAugustSeptemberOctoberNovemberDecember.New definitions 169, 48968, 94768, 06968, 082r ,73267, 02966, 65566, 75266, 07166,17465, 26964,550329 24, 319 11,101 17, 398 7,510127 24, 424 11,143 17, 4854, 826 24,25711,60317,528 7, 8554,672 24,23811. ,857 17, 554 7,8544, 408 24,14811,539 ,539 17,429 7,7444,418 23,941 11, ,301 17,183 7,7082,8332,19)1,9981,9092,4632,4797594453563314823968076785955515604614504385394824253823713805185842832292282082602031957: JanuaryFebruaryMarchAprilMayJuneJulyAugustSeptemberOctoberNovemberDecember. .65, 821 62, 578 3, 871 23, 598 10, 797 16, 84666,311 63,190 3, 970 23, 583 11, 066 16, 95566, 746 63, 865 4, 087 23, 807 11, 07' 17,10966, 951 64, 261 4,204 23,911 11,09117.21267, 893 65,178 4,475 11, 27'617,',40769, 842 66, 504 5,607 24,34611,19117, 48070, 22868, 99468, 2261,51368. 06167, 77067, 22166, 38565, 67466, 00564,87364,396332 24, 490 11, 201 17, 385953 24,45011,067 17, 304680 24,199 11,41617,430678 24,101 11, 766 17, 431338 23,832 11, 550 17, 274385 23,513 11,465 17,1257,4687,6127,7867,8437,9367,8207,8147,6137,9458,0307,8787,9083,2443,1212,8822,6902,7153,3373,0072,6092,5522,5083,1883,3744934654974615661,10584'55343640154'5121,0781,0869479157908748287798028091,0231,2946525665065175566065825545555236385417317246716065635284795055286677682892802621922422252512442512483132581 See Note, Table F-17 for explanation of differences between the old and new definitions.NOTE.—Data are not available prior to 1942 for all the age/sex groups above.See Note, Table F-17 for information on area sample used and reporting periods.Detail will not necessarily add to totals because of rounding.Source: Department of Commerce.I36
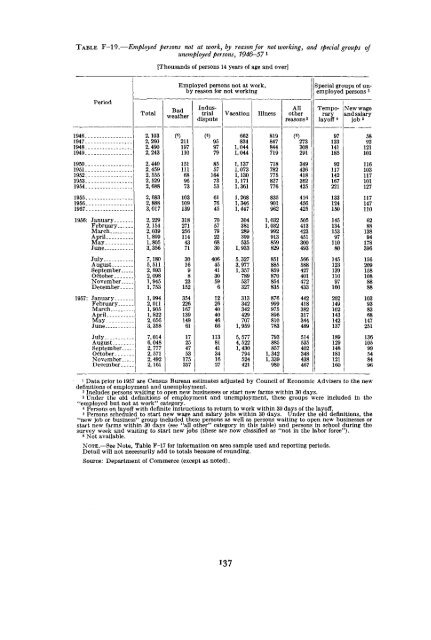
TABLE F—19.—Employed persons not at work, by reason for not working, and special groups ofunemployed persons, 7946-57l[Thousands of persons 14 years of age and over]Employed persons not at work,by reason for not workingSpecial groups of unemployedpersons 31946,.1947..1948..1949-.1950-.1951-.1952-.1953-1954.PeriodBadweatherIndustrialdispute95977985571647353Vacation6628341,0441,0441,1371,0731,1301,1711,361Illness819847844719718782775827776Allotherreasons 2)273308291349436418362425Temporarylayoff 4 9712314118592117142167221New wageand salaryjob»58921211011161031171011271955.1956.1957.1956: JanuaryFebruary...MarchApril. _MayJune6176457057792268301,2681,3461,4473043812893995351,9338359019621,0321,0329929138594164564255054134234513004931331241501451341539711080117147110628813894178396JulyAugustSeptember..OctoberNovember._December _.1957: JanuaryFebruary...MarchAprilMayJuneJulyAugustSeptember..OctoberNovember..December..1,9942,0111,9051,8222,0563,3587,0146,0482,7772,5712,4922,161406454130596122640404611381413416275,3273,9771,3577895373273133423424297071,9595,5774,5221,4307945244218518858598708548358769999758968107938858571,3421,3395665884274014724334424183823173444895145354023484384671451231391109716020214910214314213712914818112116015620915810810393147251136105995484961 Data prior to 1957 are Census Bureau estimates adjusted by Council of Economic Advisers to the newdefinitions of employment and unemployment.2 Includes persons waiting to open new businesses or start new farms within 30 days.3 Under the old definitions of employment and unemployment, these groups were included in the"employed but not at work" category.4 Persons on layoff with definite instructions to return to work within 30 days of the layoff.5 Persons scheduled to start new wage and salary jobs within 30 days. Under the old definitions, the"new job or business" group included these persons as well as persons waiting to open new businesses orstart new farms within 30 days (see "all other" category in this table) and persons in school during thesurvey week and waiting to start new jobs (these are now classified as "not in the labor force").s Not available.NOTE.—See Note, Table F-17 for information on area sample used and reporting periods.Detail will not necessarily add to totals because of rounding.Source: Department of Commerce (except as noted).137