trols, often reflect cost and demand conditions originating in earlier periods.And month-to-month changes in the consumer price index, especially asaffected by changes in the prices of food, apparel, and automobiles, mayreflect essentially seasonal variations. This factor was important in anumber of month-to-month changes in the index during 1957. In viewof the widespread interest in the movement of consumer prices, the natureand construction of the consumer price index are described in Appendix Dof this Report.Corporate ProfitsChanges in industrial prices, costs, and production are the major factorsdetermining the movement of corporate profits and their share in totalincome. During the expansion of activity that began in 1954, profitsfollowed a course different from that of other forms of income. With bothsales and margins increasing, profits rose rapidly throughout 1955. However,the increase was not extended into 1956; on the contrary, duringthat year and in the first half of 1957, corporate profits fluctuated arounda level somewhat below that reached in the second half of 1955. This failureof profits to advance during 1956 and early 1957, while other incomes wererising, reflected a number of factors, including the incurrence of additionalcosts of many kinds and an increased allocation of gross earnings to depreciationaccounts. The number of employees was rising, wage rates wereincreasing, and overhead expenditures were higher, in part as a result ofthe rapid increase in investment outlays. Although increases in prices coveredmost of the increases in unit costs of production, profit margins wereslightly reduced. Output increased only moderately, and total profits failedto rise.Profits of manufacturing corporations fell early in 1957, reflecting declinesin production and sales in a number of important industries and atendency for industrial prices to level off while some elements of cost continuedto rise. The decline in profits was accelerated later in the year, asproduction and sales fell further. In most nonmanufacturing sectors of theeconomy, where activity continued to rise, profits in general were wellmaintained during the first part of 1957. Present indications are that theprofits of these sectors also declined in the latter part of the year. Theaggregate volume of corporate profits, in which the profits of manufacturingcorporations are more important than all other types combined, fell slightlyin the first half of 1957; and by the end of the year, they had declinedsignificantly below the levels around which they had been moving earlier.ProductivityPrivate nonagricultural output rose only slightly from 1956 to 1957,and man-hours of employment were virtually unchanged. The indicatedgain in productivity accordingly was still small, though much larger than thegain from 1955 to 1956. In both instances, the increase was smaller than thelong-term average annual increase of about 2 percent recorded for the past26
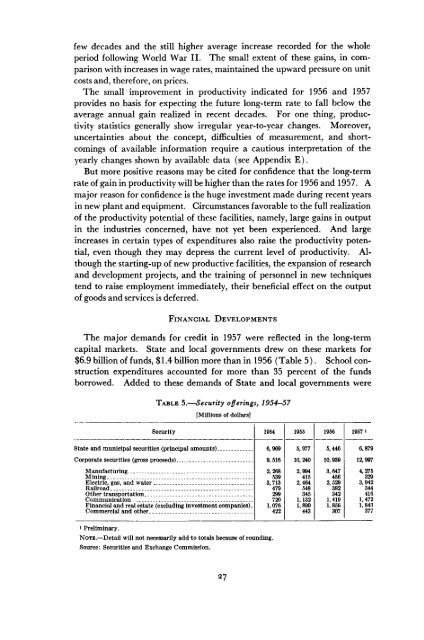
few decades and the still higher average increase recorded for the wholeperiod following World War II. The small extent of these gains, in comparisonwith increases in wage rates, maintained the upward pressure on unitcosts and, therefore, on prices.The small improvement in productivity indicated for 1956 and 1957provides no basis for expecting the future long-term rate to fall below theaverage annual gain realized in recent decades. For one thing, productivitystatistics generally show irregular year-to-year changes. Moreover,uncertainties about the concept, difficulties of measurement, and shortcomingsof available information require a cautious interpretation of theyearly changes shown by available data (see Appendix E).But more positive reasons may be cited for confidence that the long-termrate of gain in productivity will be higher than the rates for 1956 and 1957. Amajor reason for confidence is the huge investment made during recent yearsin new plant and equipment. Circumstances favorable to the full realizationof the productivity potential of these facilities, namely, large gains in outputin the industries concerned, have not yet been experienced. And largeincreases in certain types of expenditures also raise the productivity potential,even though they may depress the current level of productivity. Althoughthe starting-up of new productive facilities, the expansion of researchand development projects, and the training of personnel in new techniquestend to raise employment immediately, their beneficial effect on the outputof goods and services is deferred.FINANCIAL DEVELOPMENTSThe major demands for credit in 1957 were reflected in the long-termcapital markets. State and local governments drew on these markets for$6.9 billion of funds, $ 1.4 billion more than in 1956 (Table 5). School constructionexpenditures accounted for more than 35 percent of the fundsborrowed. Added to these demands of State and local governments wereTABLE 5.—Security offerings, 1954-57[Millions of dollars]Security1954195519561957JState and municipal securities (principal amounts).6,9695,9775,4466,879Corporate securities (gross proceeds)ManufacturingMining .Electric, gas, and waterRailroadOther transportationCommunicationFinancial and real estate (excluding investment companies).Commercial and other9,5162,2685393,7134792997201,07642210,2402,9944152,4645483451,1321,89944310,9393,6474562,5293823421,4191,85630712,9974,2753293,9423444161,4721,8433771 Preliminary.NOTE.—Detail will not necessarily add to totals because of rounding.Source: Securities and Exchange Commission.