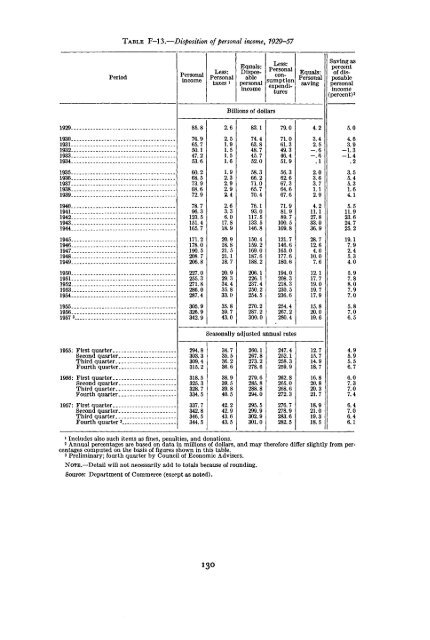
TABLE F-13.—Disposition of personal income, 1929-57PeriodPersonalincomeLess:Personaltaxes »Equals:DisposablepersonalincomeLess:PersonalconsumptionexpendituresEquals:PersonalsavingSaving aspercentof disposablepersonalincome(percent) 2Billions of dollars1929.-85.82.683.179.04.25.01930-.1931..1932..1933-.1934..76.965.750.147.253.62.51.91.51.51.674.463.848.745.752.071.061.349.346.451.93.42.5-.6-.6.14.63.9-1.3-1.4.21935..1936..1937..1938-.1939..60.268.573.968.672.91.92.32.92.92.458.366.271.065.770.456.362.667.364.667.62.03.63.71.12.93.55.45.31.64.11940..1941..1942..1943..1944-.78.796.3123.5151.4165.72.63.36.017.818.976.193.0117.5133.5146.871.981.989.7100.5109.84.211.127.833.036.95.511.923.624.725.21945..1946-.1947-,1948-.1949..171.2178.0190.5208.7206.820.918.821.521.118.7150.4159.2169.0187.6188.2121.7146.6165.0177.6180.628.712.64.010.07.619.17.92.45.34.01950..1951..1952..1953..1954-227.0255.3271.8286.0287.420.929.334.435.833.0206.1226.1237.4250.2254.5194.0208.3218.3230.5236.612.117.719.019.717.95.97.88.07.97.01955-.1956-.1957 3 .305.9326.9342.935.839.743.0270.2287.2300.0254.4267.2280.415.820.019.65.87.06.5Seasonally adjusted annual rates1955; First quarterSecond quarter..Third quarter...Fourth quarter..294.8303.3309.4315.234.735.536.236.6260.1267.8273.2278.6247.4252.1258.3259.912.715.714.918.74.95.95.56.71956: First quarterSecond quarter..Third quarter...Fourth quarter..1957: First quarterSecond quarter..Third quarter. _.Fourth quarter 3 .318.5325.3328.7334.5337.7342.8346.5344.538.939.539.840.542.242.943.643.5279.6285.8288.8294.0295.5299.9302.9301.0262.8265.0268.6272.3276.7278.9283.6282.516.820.820.321.718.921.019.318.56.07.37.07.46.47.06.46.11 Includes also such items as fines, penalties, and donations.2 Annual percentages are based on data in millions of dollars, and may therefore differ slightly from percentagescomputed on the basis of figures shown in this table.3 Preliminary; fourth quarter by Council of Economic Advisers.NOTE.—Detail will not necessarily add to totals because of rounding.Source: Department of Commerce (except as noted).I3O
TABLE F-14.—Total and per capita disposable personal income and personal consumptionexpenditures, in current and 1957 prices, 1929-57PeriodTotal disposablepersonal income(billions ofdollars)Currentprices1957prices ]Per capita disposablepersonalincome (dollars)Currentprices1957prices'Total personalconsumptionexpenditures(billions ofdollars)Currentprices1957prices ]Per capita personalconsumptionexpenditures(dollars)Currentprices1957prices ]Population(thousands)21929..1930-1931..1932..1933..1934..1935-1936..1937..1938-1939..1940..1941..1942..1943-1944..1945-1946..1947..1948-1949..1950-1951-1952..1953-1954-1955-1956-1957«.83.174.463.848.745.752.058.366.271.065.770.476.193.0117.5133.5146.8150.4159.2169.0187.6188.2206.1226.1237.4250.2254.5270.2287.2300.0260.1267.8273. 2278.6279.6285.8288.8294.0295.5299.9Fourth quarter 3 302.9301.01955: First quarterSecond quarter..Third quarter...Fourth quarter..1956: First quarterSecond quarter..Third quarter._.Fourth quarter..1957: First quarterSecond quarter..Third quarter. _.136.0125.0117.899.999.2109.0119.3134.1138.7130.9142.3152.5177.4202.3216.4234.1234.6229.0212.3218.9221.9240.5244.4250.9262.6265.9283.2296.7300.0273.2281.3285.8290.8292.8297.1296.2299.4299.1300.5300.5297.4682604514389364411458517551.5055385766978719771,0601,0751,1261,1731,2791,2611,3591,4651,5121,5681,5671,6351,7081,7521,1161,0159487997908629371,0471,0761,0061,0871,1541,3301,4991,5831,6911,6771,6201,4741,4921,4871,5861,5841,5981,6451,6371,7141,7641,75279.071.061.349.346.451.956.362.667.364.667.671.981.989.7100.5109.8121.7146.6165.0177.6180.6194.0208.3218.3230.5236.6254.4267.2280.4129.2119.3113.2101.2100.6108.8115.1126.8131.4128.8136.5144.0156.2154.5163.0175.2189.9211.0207.3207.2213.0226.4225.2230.8241.9247.2266.7276.0280.4Seasonally adjusted annual rates1,583] ,6241,649] ,674,673:L,7031,713L,7351,7371,7551,7651,7461,6631,7061,7251,7471,7521,7701, 7571,7671,7581,7591,7511,725247.4252.1258.3259.9262.8265.0268.6272.3276.7278.9283.6282.5259.9264.8270.2271.3275.2275.5275.5277.3280.1279.5281.3279.25764944104424885224975165446146657357948701,0371,1451,2111,211,279,350,390,444,456,5391,5061,5281,5591,5611,5721, 5791,5931,6071,6261,6321,6521,6381,0619118118008609049881,0209901,0421,090,172,145,191,266,357,492,438,413,428,492,459,469,5151,5211,6131,6421,6381,5821,6051,6311,6291,6461,6411,6341,6361,6461,6351,6391,619121,875123,188124,149124,949125,690126,485127,362128,181128,961129,969131,028132,122133,402134,860136,739138, 397139,928141,389144,126146,631149,188151,683154,360157,028159,636162,417165, 270168,174171, 229164,288164,934165, 662166,452167,150167,824168, 594169,416170,158170,859171,650172, 440i Dollar estimates in current prices divided by the consumer price index on a 1957 base. Personal consumptionexpenditures in this table therefore differ from the data in Table F-2.8 Population of the continental United States including armed forces overseas. Annual data are forJuly 1; quarterly data are for middle of period.3 Preliminary; fourth quarter by Council of Economic Advisers.NOTE.—Annual figures for total income and expenditures in 1957 prices and for per capita income andexpenditures in current prices are computed from data in millions of dollars.Sources: Department of Commerce, Department of Labor, and Council of Economic Advisers.