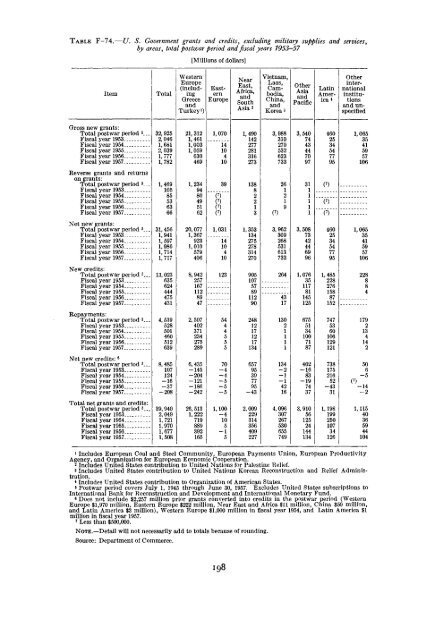
TABLE F—74.—U. S. Government grants and credits, excluding military supplies and services,by areas, total postwar period and fiscal years 1953-57[Millions of dollars]ItemTotalWesternEurope(includingGreeceandTurkey 1 )EasternEuropeNearEast,Africa,andSouthAsia 2Vietnam,Laos,Cambodia,China,andKorea 3OtherAsiaandPacificLatinAmerica*Otherinternationalinstitutionsand unspecifiedGross new grants:Total postwar period 5 ...Fiscal year 1953Fiscal year 1954Fiscal year 1955Fiscal year 1956Fiscal year 1957Reverse grants and returnson grants:Total postwar period 5 __Fiscal year 1953Fiscal year 1954Fiscal year 1955Fiscal year 1956Fiscal year 1957Net new grants:Total postwar period 5 _.Fiscal year 1953Fiscal year 1954Fiscal year 1955Fiscal year 1956Fiscal year 1957New credits:Total postwar period 5__Fiscal year 1953Fiscal year 1954Fiscal year 1955Fiscal year 1956Fiscal year 1957Repayments:Total postwar period «„Fiscal year 1953Fiscal year 1954Fiscal year 1955Fiscal year 1956Fiscal year 1957Net new credits: 6Total postwar period 5 _.Fiscalyear 1953Fiscal year 1954Fiscal year 1955Fiscal year 1956Fiscal year 1957Total net grants and credits:Total postwar period 5 __Fiscal year 1953Fiscal year 1954Fiscal year 1955Fiscal year 1956Fiscal year 195732,9252,0461,6812,0391,7771,7821,4691058553636631, 4561,9411,5971,9861,7141,71713, 0236356244444754314,5395285014605126398,485107124-16-37-20839, 9402,0491,7211,9701,6771,50821, 3121,4611,0031,0596304691,234948049516220,0771,3679231,0105794068,94225716711289472,5074023712342752896,435-145-204-121-186-24226,5131,2227198893921651,070 1,49014227728131627339 138822131,031 1,353134275278314270123 9051075789112902481217121713470 657-4 95-4 39-5 77-5 95-431,100 2,009-4 229105 314356-1 4095 2273102705326237333,96230926853161373326413021111134-2 2-142164,0963072675306557493,54074434470973,5087342441,076351178114512567551341007187402-1683-1974373,9105612524144134460253454779546025345477951,48522827615887152747536010612912173817521652-43311,198199250107341261,065354159571061,065354159571062281792134142506-5')-14-21,115403659441041 Includes European Coal and Steel Community, European Payments Union, European ProductivityAgency, and Organization for European Economic Cooperation.2 Includes United States contribution to United Nations for Palestine Relief.3 Includes United States contribution to United Nations Korean Reconstruction and Relief Administration.* Includes United States contribution to Organization of American States.5 Postwar period covers July 1, 1945 through June 30, 1957. Excludes United States subscriptions toInternational Bank for Reconstruction and Development and International Monetary Fund.6 Does not include $2,257 million prior grants converted into credits in the postwar period (WesternEurope $1,970 million, Eastern Europe $222 million, Near East and Africa $11 million, China $50 million,and Latin America $3 million), Western Europe $1,000 million in fiscal year 1954, and Latin America $1million in fiscal year 1957.7 Less than $500,000.NOTE.—Detail will not necessarily add to totals because of rounding.Source: Department of Commerce.198
TABLE F—75.—U. S. Government grants of military supplies and services, by areas,total postwar period and fiscal years 1953—57[Fiscal years, millions of dollars]AreaTotalpostwarperiod119531954195519561957Gross military grants 320,3124,3203,5062,5403,0272,376Less: Reverse grants and returns255629101411Equals: Net military grants 220, 0574,2583,4972,5313,0132,365Western Europe (excluding Greece and Turkey) 2 .Near East (including Greece, Turkey, and Africa).Other Asia and PacificAmerican RepublicsUnspecified12,0252,6664,8323341993,12031476821352,32638172545211,58228959643201, 83438773238211,24339363372251 Postwar period covers July 1, 1945 through June 30, 1957.2 Includes cash contributions to the multilateral-construction program of the North Atlantic TreatyOrganization.NOTE.—Detail will not necessarily add to totals because of rounding.Source: Department of Commerce.TABLE F—76.—Estimated gold reserves and dollar holdings of foreign countries andinternational institutions, 1937 and 1949-57[Billions of dollars]1937194919501951195219531954End ofyear195519561957 1Total15.119.023.223.324.727.329.631.532.932.5Sterling areaTotal4.92.84.63.93.54.34.44.04.23.94.42.03.72.92.53.23.42.93.12.76.86.17.07.28.510.111.613.214.114.4OtherEuropeancountriesCanada1.0 0.4.6 1.5.5 2.1.5 2.3.5 2.6.6 2.5.6 2.7.7 2.6.6 3.0.6 3.2LatinAmericanRepublics1.03.13.53.43.43.73.84.04.34.7Allothercountries1.01.72.22.52.72.52.63.03.12.8UnitedKingdomContinentalOEECcountriesanddependenciesInternationalinstitutions3.33.33.43.53.63.94.03.52.91 As of September 30.NOTE.—Includes gold reserves and dollar holdings of all foreign countries with the exception of U. S. S. R.gold reserves, and of international institutions (International Bank for Reconstruction and Development,International Monetary Fund, United Nations, and others). Holdings of the Bank for InternationalSettlements (both for its own and EPU accounts) and of the Tripartite Commission for Restitution cfMonetary Gold are included with the holdings of continental OEEC countries and dependencies. Figuresrepresent (1) reported and estimated gold reserves of central banks and governments, (2) official andprivate short-term dollar holdings reported by banks in the United States, including foreign-held deposits,U. S. Government securities, and certain other short-term liabilities to foreigners, and (3) estimated holdingsof U. S. Government bonds and notes with original maturities of more than one year. Figures for1937 are not strictly comparable with those for subsequent years owing to exclusion of long-term U. S. Governmentbonds and notes.Source: Board of Governors of the Federal Reserve System.199
- Page 3 and 4:
Economic Reportof the PresidentTRAN
- Page 5 and 6:
LETTER OF TRANSMITTALTHE WHITE HOUS
- Page 8 and 9:
commercial demands and reduce the f
- Page 10:
APPENDIXESPageA. Summary of Recomme
- Page 13 and 14:
present consumption standards. Even
- Page 15 and 16:
favored by temporary conditions or
- Page 17 and 18:
Federal fiscal policies were also d
- Page 19 and 20:
growth with reasonable stability of
- Page 21 and 22:
The decline which became apparent i
- Page 23 and 24:
CHART 2Shifts in Major Components o
- Page 25 and 26:
1957 than in 1956, but in the secon
- Page 27 and 28:
though there was no significant inc
- Page 29 and 30:
CHART 4—ContinuedEmployment and I
- Page 31 and 32:
week was 39.3 hours and average ove
- Page 33 and 34:
CHART 5Price ChangesWholesale price
- Page 35 and 36:
CHART 6Consumer PricesAfter declini
- Page 37 and 38:
few decades and the still higher av
- Page 39 and 40:
CHART 7The Pattern of Credit Expans
- Page 41 and 42:
CHART 9Member Bank ReservesMember b
- Page 43 and 44:
CHART 10Interest Rates and Bond Yie
- Page 45 and 46:
CHART 11Indicators of Agricultural
- Page 47 and 48:
various forms. On dollar sales of w
- Page 49 and 50:
Because of the high level of privat
- Page 51 and 52:
TABLE 7.—World industrial product
- Page 53 and 54:
CHART 13World and U. S. Foreign Tra
- Page 55 and 56:
CHART 14U. S. Balance of PaymentsTh
- Page 57 and 58:
a still larger outflow of capital.
- Page 59 and 60:
Chapter 4Economic Opportunities and
- Page 61 and 62:
of the sources of strength for the
- Page 63 and 64:
The strength of our financial insti
- Page 65 and 66:
Chapter 5A Legislative Program To H
- Page 67 and 68:
growth and stability. Although Fede
- Page 69 and 70:
housing loans insured by the Federa
- Page 71 and 72:
directions, without sacrificing eit
- Page 73 and 74:
medical and dental teaching facilit
- Page 75 and 76:
standards and help maintain the inc
- Page 77 and 78:
funds, on financial dealings betwee
- Page 79 and 80:
on basic crops and dairy products.
- Page 81 and 82:
partners, and particularly on the s
- Page 83:
FEDERAL ECONOMIC STATISTICSA well-c
- Page 87 and 88:
Summary of Recommendations in the E
- Page 89 and 90:
e) Authorize the Secretary of Labor
- Page 91:
Appendix BREPORT TO THE PRESIDENT O
- Page 95 and 96:
Report to the President on the Acti
- Page 97:
Advisory Board on Economic Growth a
- Page 101 and 102:
Program for Improving Federal Stati
- Page 103 and 104:
various divisions. Improvements in
- Page 105 and 106:
InventoriesSeparate stage-of-fabric
- Page 107:
Appendix DTHE CONSUMER PRICE INDEX9
- Page 110 and 111:
total market basket since the base
- Page 112 and 113:
described are applied whenever poss
- Page 114 and 115:
were employed under contracts conta
- Page 117 and 118:
Productivity StatisticsThe terms "p
- Page 119 and 120:
5 percent. Some improvement over th
- Page 121:
Appendix FSTATISTICAL TABLES RELATI
- Page 124 and 125:
Prices:PageF-36. Wholesale price in
- Page 127 and 128:
NATIONAL INCOME OR EXPENDITURETABLE
- Page 129 and 130:
TABLE F-2.—Gross national product
- Page 131 and 132:
TABLE F—4.—Gross national produ
- Page 133 and 134:
TABLE F—6.—The Nation's income,
- Page 135 and 136:
TABLE F-8.—Gross private domestic
- Page 137 and 138:
TABLE F-10.—Relation of gross nat
- Page 139 and 140:
TABLE F-12.—Sources of personal i
- Page 141 and 142:
TABLE F-14.—Total and per capita
- Page 143 and 144:
TABLE F—16.—Sources and uses of
- Page 145 and 146:
TABLE F-17.—Noninstitutional popu
- Page 147 and 148:
TABLE F—19.—Employed persons no
- Page 149 and 150:
TABLE F-21.—Unemployment insuranc
- Page 151 and 152:
TABLE F-22.—Number of wage and sa
- Page 153 and 154:
1929.193019311932193319341935193619
- Page 155 and 156:
TABLE F-26.—Average weekly hours
- Page 157 and 158: TABLE F-28.—Labor turnover rates
- Page 159 and 160: TABLE F-29.—Industrial production
- Page 161 and 162: TABLE F-31.—New construction acti
- Page 163 and 164: TABLE F-33.—Housing starts and ap
- Page 165 and 166: TABLE F-35.—Manufacturers* sales,
- Page 167 and 168: TABLE F-36.—Wholesale price index
- Page 169 and 170: TABLE F-37.— Wholesale price inde
- Page 171 and 172: TABLE F—39.—Consumer price inde
- Page 173 and 174: TABLE F—41.—Loans and investmen
- Page 175 and 176: TABLE F-43.—Bond yields and inter
- Page 177 and 178: TABLE F—44.—Short- and intermed
- Page 179 and 180: TABLE F-46.—Mortgage debt outstan
- Page 181 and 182: GOVERNMENT FINANCETABLE F—48.—U
- Page 183 and 184: TABLE F-50.—Federal budget receip
- Page 185 and 186: TABLE F-52.—Government cash recei
- Page 187 and 188: TABLE F—54.—Reconciliation of F
- Page 189 and 190: CORPORATE PROFITS AND FINANCETABLE
- Page 191 and 192: TABLE F-58.—Relation of profits a
- Page 193 and 194: TABLE F-59.—Sources and uses of c
- Page 195 and 196: TABLE F-61.—State and municipal a
- Page 197 and 198: Period19291930193119321933193419351
- Page 199 and 200: TABLE F-65.—Farm population, empl
- Page 201 and 202: TABLE F—67.—Indexes of prices r
- Page 203 and 204: TABLE F—70.—Selected indicators
- Page 205 and 206: TABLE F—72.—United States balan
- Page 207: TABLE F—73.—United States merch