


Create successful ePaper yourself
Turn your PDF publications into a flip-book with our unique Google optimized e-Paper software.
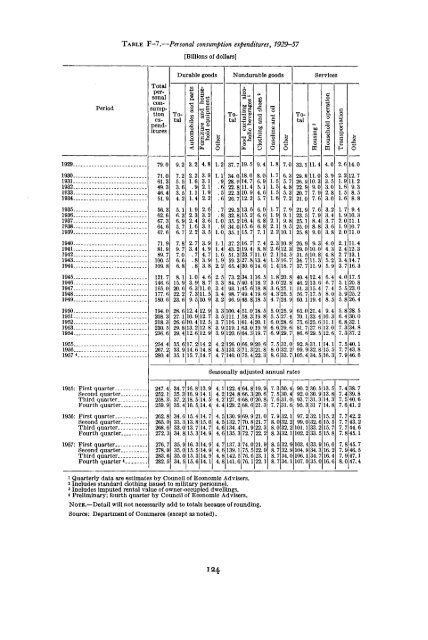
TABLE F-7.—Personal consumption expenditures, 1929-57[Billions of dollars]PeriodDurable goodsTotalpersonalconsumptionexpendituresTotalTotalNondurable goodsServices1929-1930-1931-1932-1933-1934-1935-1936-1937-1938-1939..1940-1941-1942-1943-1944-1945-1946-1947-1948-1949-1950-1951-1952-1953-1954..1955..1956-1957 «.79.071.061.349.346.451.956.362.667.364.67.671.981.89.7100.5109.121.7146.165.0177.6180.6254.4267.2280.49.27.25.53.3.54.25.16.36.95.76.77.89.77.06.6.88.115.920.622.223.1.0 4.3.9 8.76.3 11.07.3 11.59. 5 10. 9194.0 28. 6 12. 4 12. 9208.3 10. 9 12. 7218.3 26. 6 10. 4 12.5230.5 29.8 13.236.6 29.4 12. 6 12. 937. 7 19. 534 0 18J28.9 14.722.8 11.422.3 10.926. 7 12. 229. 3 13. 1.632.8 15.235. 2 16. L 434.0 15.35.1 15.737.2 16.7 7.443.2 19.4 8.851. 3 23. 1.7 11.059. 3 27. 8 13. 465. 4 30.6 14.73. 2 34. 1 16.584. , 5 40. .4 18.293.1 45. 18.898. 7 49. 1.4 19.69 48.8 18.53. 3 100. 4 51.0 18.5111.1 58.3119.8116.1 61. 4 20.1119.120. 6 64 19.72.32.62.17.0 32.1 11.4 4.0 2. 6 14.06.35.74.85.37.27.99.19.89.510.110.12.314.51. 3 16. 71.4 18.71. 8 20.81.83. 6 25.14. 3 25.4. 7 24.. 95. 5 27. 40 28.66. 6 29. 66. 9 29. 729. 8 11.26. 9 10.22.920.721.021.23.525.125.025.826.9 9.329. 0 10. i.O31.5 10.34.7 11.337.7 11.940.4 12.446. i. 2 13.51. 5.456. 17.560.1 19.465. 0 21.70. 1 23.75.81.7 27.686.6 29.53.93.53.02.83.03.23.43.73.3.4.04.34.85.25.96.46.77.48.08.59.410.311.112.012.635. 6 17. 2 14. 2 4. 2 126. 0 66. 9 20. 6 7. 5 31. 0 92. 8 31.1 14.133. 9 14. 14.8 4. 5 133. 3 71.3 21.8 8. 0 32. 2 99. 8 15.535.1 L7 4.7 140. 0 75.4 22. 3 8. 6 33. 7 105. 4 34. 5 16.32. 2 12. 71.9 11.21.6 9.31.5 8.59.410.311. 110.711.011.412.313.114.716.317.51 20. 1.85.5 23.05. 9 25. .25. 8 26. 45. 8 28. 56. 4 30. 06. 8 32. 17. 3 34. 87. 3 37. 27. 5 40.17. 7 43. 87.9 46. 6Seasonally adjusted annual rates1955: First quarter...Second quarter.Third quarter __Fourth quarter.1956: First quarter._.Second quarter.Third quarter..Fourth quarter1957: First quarter...Second quarter.Third quarter..Fourth quarter247.4 34.' 16. 8 13. 9252.1 35.3 1258.3 37. 2 18. 5 14.5259.9 35.4 16. 5 14. 4262.8265.0268.272.3276.278.9283.282.534.6 15.4 14.33. 3 13. 8 15. 033. 0 13. 7 14. 734. 8 15. 3 14. 935. 9 16. 3 14. 935. 0 15. 5 14. 935. 0 15. 3 14. 934. 5 15. 6 14.1122. 4 64. 8 19. 9124. 8 66. 6. 3 20. 6127. . 4 68. 0 20. 8129. 2 68. 6 21. 34. 5 130. 9 69. 9 21. 04. 5 132. 7 70. 8 21.4. 6 134. 4 71. 9 22. 34. 6 135. 3 72. 7 22. 24. 7 137. 3 74. 0 21.75. 5 22. 04. 8 142. 5 76. 6 23.14. 8 141. 0 76.1 22.13 30.5 30.7 31.90. 2 30. i. 5 13. 592. 0 30. I. 9 13. 893. 7 31. 3 14. 395. 3 31 78. 5 32. 9 103. 4 33. 9 16. 08. 7 32. 9 104. 9 34. 3 16. 28. 7 34. 0 106.1 34.78. 7 34.1 107. 0 35.0 16.6. 4 38.. 4 39.. 5 40.. 6 41.7. 9 32.18. 0 32. 297. 2 32.1 15.299. 0 32. 6 15.57. 7 42. 27. '. 7 43.8. 0 32. 2 101.1 33. 2 15. 78. 3 32.1 102. 2 33. 5 15. 87.7. 8 45.17. 8 45. 77. 9 46. 57. 9 47.18.0 47. 41 Quarterly data are estimates by Council of Economic Advisers.2 Includes standard clothing issued to military personnel.3 Includes imputed rental value of owner-occupied dwellings.* Preliminary; fourth quarter by Council of Economic Advisers.NOTE.—Detail will not necessarily add to totals because of rounding.Source: Department of Commerce (except as noted).124


