


Create successful ePaper yourself
Turn your PDF publications into a flip-book with our unique Google optimized e-Paper software.
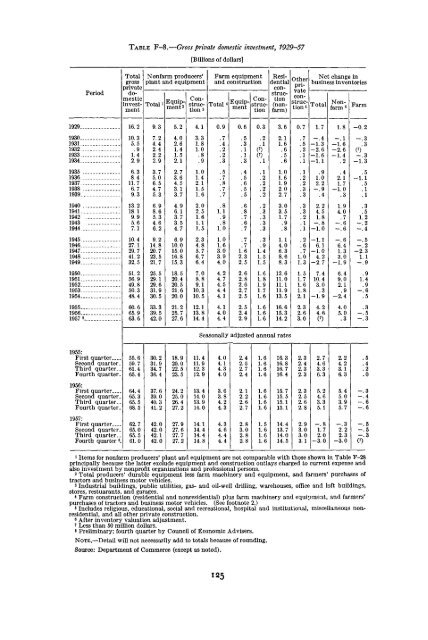
TABLE F-8.—Gross private domestic investment, 1929-57[Billions of dollars]1929.1930..1931.1932.1933..1934.19351936193719381939.19401941.194219431944.1945.1946-1947,19481949-1950.1951-1952.1953.1954.1955.1956.1957*PeriodTotalprivatedomesticinvestment16.210.35.5.91.42.96.38.411.76.79.313.218.19.95.67.110.427.129.741.232.551.256.949.850.348.460.665.963.6Nonfarm producers'plant and equipmentTotal9 37.24.42.42.22.93.75.06.54.75.35.34.66.29.214.820.723.521.725.529.129.631.930.533.339.542.0Equipment25.24.02.61.41.52.12.73.64.53.13.74.96.13.73.54.76.910.015.016.815.318.520.420.521.620.021.225.727.64.13.31.81.01.01.42.11.51.62.02.51.61.11.52.34.85.76.76.47.08.89.110.310.512.113.814.4Farm equipmentand constructionTotal0.9.7.4.2.2.3.5.7.8.7.71.01.01.63.03.94.04.24.74.54.44.14.14.04.4ConstructionsEquipment0.6.5.3.1.1.3.4.5.6.5.5.6.8.7.6.7.7.71.62.32.52.62.82.62.72.52.52.42.90.3.2.1( 7 )(01.1.2.2.2.2.2.3.3.3.3.3.91.41.51.51.61.81.91.71.61.61.61.6ConstructionResidentialconstruc-tion(nonfarm)3.62.11.6.6.51.01.61.92.02.73.03.51.71.14.06.38.68.312.611.011.111.913.516.615.314.20.7.7.5.2.1.1.1.2.2.3.71.01.31.51.71.61.82.12.32.63.0Net change inbusiness inventoriesTotal1.7-.4-1.3-2.6-1.6-1.1.91.02.2-.9.42.24.51.8-.8-1.0-1.16.1-1.04.2-2.77.410.43.0.3-1.94.24.6(0OtherprivateconstructionsNonfarm6Farm1.8 -0.2-.1 -.3-1.6 .3-2.6 ( 7 )-1.4 -.3.2 -1.3.4 .52.1 -1.11.7 .5-1.0 .1.3 .11.9 .34.0 .5.7 1.2-.6 -.2-.6 -.4-.6 -.56.4 -.21.3 -2.33.0 1.1-1.96.49.02.1.9 -.6-2.4 .54.0 .35.0 -.5.3 -.3Seasonally adjusted annual rates1955:First quarterSecond quarter.Third quarter..Fourth quarter.55.659.761.465.430.231.934.736.418.920.022.523.511.411.912.312.94.04.14.34.02.42.52.72.41.61.61.61.616.316.816.716.42.32.42.32.32.74.63. 36.32.24.23.16.31956:First quarterSecond quarter.Third quarter..Fourth quarter.64.465.365.568.537.639.040.341.224.225.026.427.213.414.013.914.03.63.84.24.32.12.22.62.71.61.61.61.615.715.515.115.12.32.52.62.85.24.63.35.15.45.03.95.71957:First quarterSecond quarter.Third quarter. .Fourth quarter 8 .62.765.065.561.042.042.042; 142.027.927.627.727.214.114.414.414.84.34.64.44.42.83.02.82.81.51.61.61.614.413.714.014.52.93.03.03.1-.81.72.0-3.0-.32.22.3-3.0-.5-.5-.3CO1 Items for nonfarm producers' plant and equipment are not comparable with those shown in Table F-28principally because the latter exclude equipment and construction outlays charged to current expense andalso investment by nonprofit organizations and professional persons.2 Total producers' durable equipment less farm machinery and equipment, and farmers' purchases oftractors and business motor vehicles.3 Industrial buildings, public utilities, gas- and oil-well drilling, warehouses, office and loft buildings,stores, restuarants, and garages.* Farm construction (residential and nonresidential) plus farm machinery and equipment, and farmers'purchases of tractors and business motor vehicles. (See footnote 2.)s Includes religious, educational, social and recreational, hospital and institutional, miscellaneous nonresidential,and all other private construction.6 After inventory valuation adjustment.7 Less than 50 million dollars.s Preliminary; fourth quarter by Council of Economic Advisers.NOTE.—Detail will not necessarily add to totals because of rounding.Source: Department of Commerce (except as noted).125


