INTERNATIONAL TRANSACTIONSTABLE F-71.—United States balance of payments, 1953-57Excluding transfers of goods and services under military grant programs[Millions of dollars]Item1953195419551956First 3 quarters19561957United States payments: Total19, 68519, 87621, 94425, 74819,09320, 480Imports of goods and services: Total16, 64416, 08817, 93719, 81014, 96715, 533Merchandise, adjusted, excludingmilitaryTransportationTravelMiscellaneous services, excludingmilitaryMilitary expendituresIncome on investments:PrivateGovernmentUnilateral transfers, net, excludingmilitary: TotalGovernment grantsRemittances and other transfers. _10,9901,0819296592,535364862,4541,83761710, 3541,0261,0096772,603360592,2621,64761511, 5271,2041,1537282,823408942,4861,90158512, 7911,4321,2757842,9104641542,3321,6956379,5801,0851,0355872,2253481071,7001,2344669,8741,0761,0996052,3973321501,8051,270535United States capital, net: Total5871,5261,5213,6062,4263,142Private, net: Total3691,6191,2112,9801.9012,542Direct investments, netNew issuesRedemptionsOther long-term, netShort-term, netGovernment, net: Total721270-139-316-167218664309-124135635-93779128-1903031913101,839457-1693195346261,142309-1153092565251,698438-111301216600Long-term capital, outflowRepaymentsShort-term, net716-487-11306-507108383-416343534-479571410-307422402-521719United States receipts: Total17, 28718,19320,34924,06017, 42620,153Exports of goods and services: Total..17,08117,94920, 00323,51816,99719, 810Merchandise, adjusted, excludingmilitaryTransportationTravelMiscellaneous servicesMilitary transactionsIncome on investments:Direct investmentsOther privateGovernment12, 2811,1985749261921,44221625212, 7991,1715959781791,72523027214, 2801,4206541,0012041,91225827417, 3211,6197051,0591562,16030419412, 4621,1835437771201,53722015514,6641,4645998281511,680264160Foreign long-term investments in theUnited States206244346542429343Balance (net United States receipts):Total-2,398-1,683-1, 595-1,688-1,667-327Increase in liquid dollar holdingsby foreign countries and internationalinstitutions9411,2181,1081,3021,577102United States gold sales [purchases(-)]1,16129841-306-279-700Errors and omissions296167446692369925Source: Department of Commerce.194
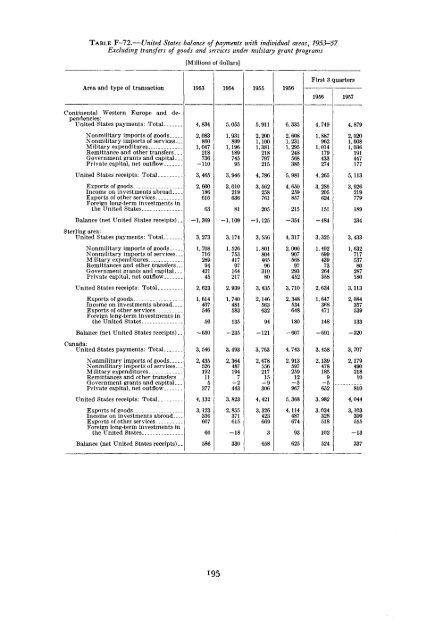
TABLE F—72.—United States balance of payments with individual areas, 1953—57Excluding transfers of goods and services under military grant programs[Millions of dollars]Area and type of transaction1953195419551956First 3 quarters19561957Continental Western Europe and dependencies:United States payments: Total-. .Nonmilitary imports of goodsNonmilitary imports of services.._Military expendituresRemittance and other transfers...Government grants and capital.._Private capital, net outflowUnited States receipts: TotalExports of goods _ _ .Income on investments abroadExports of other servicesForeign long-term investments inthe United States_4,8342,0838601,047218736-1103,4652,600186616635,0551,9318991,196189745953,9463,010219636815,9112,2001,1001,3812187972154,7863,5622587612056,3352,6081,2311,2952485683855, 9814,6502598572154,7491,8879621,0141794332744,2653,2852056241514,8792,0201,0081,0361914471775,1133,926219779189Balance (net United States receipts)..-1,369-1,109-1,125-354-484234Sterling area:United States payments: Total . .. .3,2733,1743,5564,3173,3253,433Nonmilitary imports of goodsNonmilitary imports of services...Military expenditures .Remittances and other transfers.._Government grants and capitalPrivate capital, net outflow1,70871628994421451,526753417971642171,80180446596310802,000907568972934521,492699439732643581,63271753780287180United States receipts: Total2,6232,9393,4353,7102,6343,113Exports of goodsIncome on investments abroadExports of other servicesForeign long-term investments inthe United States1,614407546561,7404815831352,146563632942,3485346481801,6473684711482,084357539133Balance (net United States receipts)..-650-235-121-607-691-320Canada:United States payments: Total3,5463,4933,7634,7433,4583,707Nonmilitary imports of goodsNonmilitary imports of services.._Militarv expendituresRemittances and other transfers. _Government grants and capital...Private capital, net outflowUnited States receipts: TotalExports of goodsIncome on investments abroadExports of other services „ .Foreign long-term investments inthe United States2,4355261921153774,1323,123336607662,36448719424433,8232,855371615-182,67855621715Q3064,4213,32642366932,913597259129675,3684,114487674932,13947818596523,9823,0343285181022,179490218108104,0443,103399555— 13Balance (net United States receipts) _.586330658625524337195
- Page 3 and 4:
Economic Reportof the PresidentTRAN
- Page 5 and 6:
LETTER OF TRANSMITTALTHE WHITE HOUS
- Page 8 and 9:
commercial demands and reduce the f
- Page 10:
APPENDIXESPageA. Summary of Recomme
- Page 13 and 14:
present consumption standards. Even
- Page 15 and 16:
favored by temporary conditions or
- Page 17 and 18:
Federal fiscal policies were also d
- Page 19 and 20:
growth with reasonable stability of
- Page 21 and 22:
The decline which became apparent i
- Page 23 and 24:
CHART 2Shifts in Major Components o
- Page 25 and 26:
1957 than in 1956, but in the secon
- Page 27 and 28:
though there was no significant inc
- Page 29 and 30:
CHART 4—ContinuedEmployment and I
- Page 31 and 32:
week was 39.3 hours and average ove
- Page 33 and 34:
CHART 5Price ChangesWholesale price
- Page 35 and 36:
CHART 6Consumer PricesAfter declini
- Page 37 and 38:
few decades and the still higher av
- Page 39 and 40:
CHART 7The Pattern of Credit Expans
- Page 41 and 42:
CHART 9Member Bank ReservesMember b
- Page 43 and 44:
CHART 10Interest Rates and Bond Yie
- Page 45 and 46:
CHART 11Indicators of Agricultural
- Page 47 and 48:
various forms. On dollar sales of w
- Page 49 and 50:
Because of the high level of privat
- Page 51 and 52:
TABLE 7.—World industrial product
- Page 53 and 54:
CHART 13World and U. S. Foreign Tra
- Page 55 and 56:
CHART 14U. S. Balance of PaymentsTh
- Page 57 and 58:
a still larger outflow of capital.
- Page 59 and 60:
Chapter 4Economic Opportunities and
- Page 61 and 62:
of the sources of strength for the
- Page 63 and 64:
The strength of our financial insti
- Page 65 and 66:
Chapter 5A Legislative Program To H
- Page 67 and 68:
growth and stability. Although Fede
- Page 69 and 70:
housing loans insured by the Federa
- Page 71 and 72:
directions, without sacrificing eit
- Page 73 and 74:
medical and dental teaching facilit
- Page 75 and 76:
standards and help maintain the inc
- Page 77 and 78:
funds, on financial dealings betwee
- Page 79 and 80:
on basic crops and dairy products.
- Page 81 and 82:
partners, and particularly on the s
- Page 83:
FEDERAL ECONOMIC STATISTICSA well-c
- Page 87 and 88:
Summary of Recommendations in the E
- Page 89 and 90:
e) Authorize the Secretary of Labor
- Page 91:
Appendix BREPORT TO THE PRESIDENT O
- Page 95 and 96:
Report to the President on the Acti
- Page 97:
Advisory Board on Economic Growth a
- Page 101 and 102:
Program for Improving Federal Stati
- Page 103 and 104:
various divisions. Improvements in
- Page 105 and 106:
InventoriesSeparate stage-of-fabric
- Page 107:
Appendix DTHE CONSUMER PRICE INDEX9
- Page 110 and 111:
total market basket since the base
- Page 112 and 113:
described are applied whenever poss
- Page 114 and 115:
were employed under contracts conta
- Page 117 and 118:
Productivity StatisticsThe terms "p
- Page 119 and 120:
5 percent. Some improvement over th
- Page 121:
Appendix FSTATISTICAL TABLES RELATI
- Page 124 and 125:
Prices:PageF-36. Wholesale price in
- Page 127 and 128:
NATIONAL INCOME OR EXPENDITURETABLE
- Page 129 and 130:
TABLE F-2.—Gross national product
- Page 131 and 132:
TABLE F—4.—Gross national produ
- Page 133 and 134:
TABLE F—6.—The Nation's income,
- Page 135 and 136:
TABLE F-8.—Gross private domestic
- Page 137 and 138:
TABLE F-10.—Relation of gross nat
- Page 139 and 140:
TABLE F-12.—Sources of personal i
- Page 141 and 142:
TABLE F-14.—Total and per capita
- Page 143 and 144:
TABLE F—16.—Sources and uses of
- Page 145 and 146:
TABLE F-17.—Noninstitutional popu
- Page 147 and 148:
TABLE F—19.—Employed persons no
- Page 149 and 150:
TABLE F-21.—Unemployment insuranc
- Page 151 and 152:
TABLE F-22.—Number of wage and sa
- Page 153 and 154: 1929.193019311932193319341935193619
- Page 155 and 156: TABLE F-26.—Average weekly hours
- Page 157 and 158: TABLE F-28.—Labor turnover rates
- Page 159 and 160: TABLE F-29.—Industrial production
- Page 161 and 162: TABLE F-31.—New construction acti
- Page 163 and 164: TABLE F-33.—Housing starts and ap
- Page 165 and 166: TABLE F-35.—Manufacturers* sales,
- Page 167 and 168: TABLE F-36.—Wholesale price index
- Page 169 and 170: TABLE F-37.— Wholesale price inde
- Page 171 and 172: TABLE F—39.—Consumer price inde
- Page 173 and 174: TABLE F—41.—Loans and investmen
- Page 175 and 176: TABLE F-43.—Bond yields and inter
- Page 177 and 178: TABLE F—44.—Short- and intermed
- Page 179 and 180: TABLE F-46.—Mortgage debt outstan
- Page 181 and 182: GOVERNMENT FINANCETABLE F—48.—U
- Page 183 and 184: TABLE F-50.—Federal budget receip
- Page 185 and 186: TABLE F-52.—Government cash recei
- Page 187 and 188: TABLE F—54.—Reconciliation of F
- Page 189 and 190: CORPORATE PROFITS AND FINANCETABLE
- Page 191 and 192: TABLE F-58.—Relation of profits a
- Page 193 and 194: TABLE F-59.—Sources and uses of c
- Page 195 and 196: TABLE F-61.—State and municipal a
- Page 197 and 198: Period19291930193119321933193419351
- Page 199 and 200: TABLE F-65.—Farm population, empl
- Page 201 and 202: TABLE F—67.—Indexes of prices r
- Page 203: TABLE F—70.—Selected indicators
- Page 207 and 208: TABLE F—73.—United States merch
- Page 209: TABLE F—75.—U. S. Government gr