TABLE F—55.—State and local government revenues and expenditures, selected fiscal years, 1927-56[Millions of dollars]Revenues by source 2Expenditures by function 2Fiscal year 1TotalPropertytaxesSalesandgrossreceiptstaxesIndividualincometaxesCorporationnetincometaxesRevenuefromFederalGovernmentAllotherrevenue3TotalEducationHighwaysPublicwelfareAllother 419277,2714,73047070921161,7937,2102,2351,8091513,0151932193419361938 .7,2677,7138,5049,2284,4874,0764,0934,4407521,0081,4841,794748015321879491131652321,0511,0578001,6431,4491,6041,8117,7657,1817,6448,7572,3111,8312,1772,4911,7411,5091,4251,6504448898271,0693,2692,9523,2153, .547194019421944194619489,60910,41810,90812,35717,2514,4304,5374,6044,9866,1261,9822,3512,2892,9864,4422242763424225431562724514475929458589548551,8611,8722,1232,2692,6613,6859,2299,1908,86311,02817,6842,6382,5862,7933,3565,3791,5731,4901,2001,6723,0361,1561,2251,1331,4092,0993,8623,8893,7374,5917,170195019521953195420,91125,18127, 30629,0137,3498,6529,3759,9675,1546,3576,9277,2767889981,0651,1275938468177782,4862,5662,8702,9664,5415,7636,2516,89722, 78726,09827, 91030,7017,1778,3189,39010,5573,8034,6504,9875,5272,9402,7882,9143,0608,86710,34010,61911, 5561955.195631,07334,66710,73511, 7497,6438,6911,2371,5387448903,1313,3357,5848,46533,72436,71111,90713,2206,4526,9533,1683,13912,19613,3971 Fiscal years not the same for all governments.2 Excludes revenues or expenditures of publicly owned utilities and liquor stores, and of insurance-trustactivities. Intergovernmental receipts and payments between governments in these categories are alsoexcluded.3 Includes licenses and other taxes and charges and miscellaneous revenues.4 Includes expenditures for health, hospitals, police, local fire protection, natural resources, sanitation,housing and community redevelopment, local recreation, general control, interest on general debt, andother and unallocable expenditures.NOTE.—Data are not available for intervening years.See Table F-47 for net debt of State and local governments.Detail will not necessarily add to total because of rounding.Source: Department of Commerce (Bureau of the Census).178
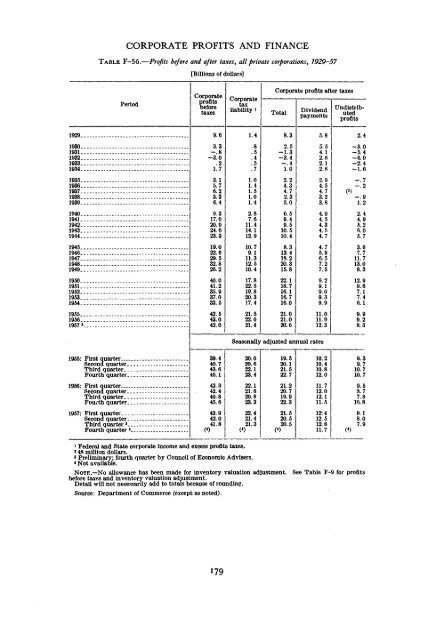
CORPORATE PROFITS AND FINANCETABLE F-56.—Profits before and after taxes, all private corporations, 1929—57[Billions of dollars]PeriodCorporateprofitsbeforetaxesCorporatetaxliability »Corporate profits after taxesTotalDividendpaymentsUndistributedprofits1929.1930.1931.1932.1933.1934.9.63.3-.8-3.0.21.71.4.8.5.4.5.78.32.5-1.3-3.4-.41.05.85.54.12.62.12.62.4-3.0-5.4-6.0-2.4-1.61935.1936.1937.1938.1939.1040.1941.1942.1943.1914..3.15.76.23 46.49.317.020.924.623.31.01.41.51.01.42.87.611.414.112.92.24.34.72.35.06.59.49.510.510.42.94.54.73.23.84.04.54.34.54.7-.7-.2-.91.22.44.95.26.05.71945..1946..1947..1948..1949..19.022.629.532.826.210.79.111.312.510.48.313.418.220.315.84.75.86.57.27.53.67.711.713.08.31950.1951..1952..1953..1954..40.041.235.937.033.517.822.519.820.317.422.118.716.116.716.09.29.19.09.39.912.99.67.17.46.11955..1956..1957 342.543.042.021.522.021.421.021.020.611.011.912.39.99.28.31955: First quarterSecond quarter..Third quarter. _.Fourth quarter..1956: First quarterSecond quarter..Third quarter...Fourth quarter..1957: First quarterSecond quarter .Third quarter 3 ..Fourth quarter 3 .Seasonally adjusted annual rates10.210.410.812.011.712.012.111.512:412.512.611.79.39.710.710.79.58.77.810.89.18.07.91 Federal and State corporate income and excess profits taxes.* 48 million dollars.3 Preliminary; fourth quarter by Council of Economic Advisers.< Not available.NOTE.—No allowance has been made for inventory valuation adjustment.before taxes and inventory valuation adjustment.Detail will not necessarily add to totals because of rounding.Source: Department of Commerce (except as noted).See Table F-9 for profits179