TABLE F-22.—Number of wage and salary workers in nonagr{cultural establishments, 1929-57 *[Thousands of employees]PeriodTotalTotalManufacturingandsalaryworkersDurablegoodsNondurablegoodsTrade 2MiningContractconstructionTransportationandpublicutilitiesFinanceService2Government(Federal,State,andlocal)192931, 04110, 5341,0781,4973,9076,4011,4313,1273,0661930193119321933.193429,14326, 38323, 37723, 46625, 6999,4018,0216,7977,2588,346(3)(3)(3)(3)( 3 )(3)( 3 )(3)(3)( 3 )1,0008647227358741,3721,2149708098623,6753,2432,8042,6592,7366,0645,5314,9074,9995,5521,3981,3331.2701,2251,2473,0842,9132,6822,6142,7843,1493,2643.2253,1673,298193519361937.1938193926, 79228, 80230, 71828, 90230,3118,9079, 65310, 6069,25310, 078(3)(3)(3)(3)4,683(3)(3)( 3 )(3)5,3948889371,0068828459121,1451,1121,0551,1502,7712.9563,1142,8402,9125,6926,0766, 5436,4536,6121,2621,3131,3551,3471,3992,8833,0603,2333,1963,3213,4773,6623,7493,8763,9951940194119421943194432, 05836, 22039, 77942,10641, 53410, 78012, 97415, 05117, 38117,1115,3376,9458,80411, 07710, 8585,4436,0286,2476,3046,2539169479839178831,2941,7902, 1701,5671,0943,0133,2483,4333,6193,7986,9407,4167,3337,1897,2601,4361,4801,469I, 4351,4093,4773,7053,8573,9193,9344,2024,6605,4836,0806,0431945194619471948194940, 03741, 28743, 46244, 44843, 31515,30214, 46115, 29015, 32114,1789,0797,7398, 3728, 3127,4736,2226,7226,9187,0106, 7058268529439829181,1321,6611,9822,1692,1653,8724,0234,1224,1413,9497,5228,6029,1969,5199,5131,4281,6191.6721,7411,7654,0114,4744,7834,9254,9725,9445,5955,4745,6505, 8561950195119521953195444, 73847, 34748, 30349, 68148, 43114. 96716,10416, 33417, 23815, 9958,0859,0809,34010,1059,1226,8827,0246,9947,1336,8738899168858521112,3332,6032,6342,6222,5933,9774,1664,1854,2214,0099,64510, 01210, 28110, 52710, 5201,8241,8921,9672,0382,1225,0775,2645,4115,5385,6646, 0266,3896,6096,6456,751195519561957 450, 05651, 87852, 55016. 56316,90516, 8009,5499,8259,8077,0147,0806,9931118168402,7592,9933,0254,0624,1574.15610, 84611,29211,5542,2192,3062,3425, 9166,2316,4546,9147,1787,379Seasonally adjusted1955: JanuaryFebruary. -MarchAprilMayJune48, 82748, 90949, 23249, 46149, 82450,18116, 02916,11716, 24116,41116, 53016, 6589,1349,2149,2989,4259,5239,6216,8956,9036,9436,9867,0077,0377527507587677787832,6242,6182,7032,7592,8132,8233, 9923,9843,9843,9484,0084,07610, 63110, 64510, 70110, 68210,74810, 8182,1662,1762,1852,1872,1972,2125, 7885,8025,8265,8515,8575,8896,8456,8176,8346,8566,8936,922JulyAugustSeptember-OctoberNovember.December.50, 29550, 42150, 62450,78850, 96551,16316,65516,68716, 68316, 82216, 95416, 9939,6349.6389,6469,7429,8419,8827,0217,0497,0377,0807,1137,1117837787917917927942,8292,8132,8102,7772,7602,7504,0904,1114,1184,1234,1464,14510, 88710, 93110, 97211,00111,04511,1222,2232,2382,2542,2592,2562,2635,9065,9176,0136,0116,0526,0816,9226,9466,9837,0046,9607,0151956- January....February..MarchAprilMayJune51, 28551, 36851, 27451, 62451, 79952,02616, 95116, 89816, 81216, 93116, 91916, 8959,8639,8029,7369,8359,8049,7917,0887,0967.0767,0967,1157,1047927P48018168148292,7682,8022,8342,9022,9853,1134,1544, 1414, 1314,1374,1524,17411,19711,23111,16311,26011,25311,3072,2712,2842,2882,2892,2992,3056,1076,1456,1426,1766,1896,2277,0457.0737, 1037,1137.1887,176JulyAugustSeptember.OctoberNovember.December.51, 45652. 18052,14852, 36752, 44152, 54116, 46816, 90116, 87417,04517,07217,1069,4229,8219,8169,95910,01910, 0357,0467,0807,0587,0867,0537,0717698318388368338333,0433,0833,0803,0803,0673,0744,1304,1594,1604,1784,1734,16911,30311,36411,31911,37211,38811,4082,3032,3262,3252,3272,3262,3206,2656,2626,2916,2806,3276,3597,1757,2547,2617,2497,2557,272See footnotes at end of table.14O
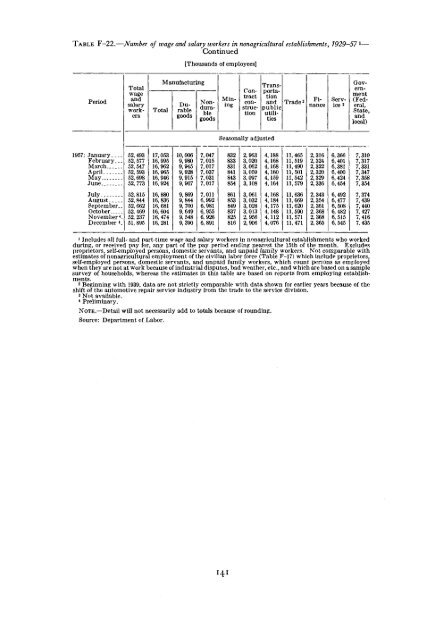
TABLE F-22.—Number of wage and salary workers in nonagi (cultural establishments, 1929-57 1 —Continued[Thousands of employees]PeriodTotalManufacturingTotalwageandsalaryworkersDurablegoodsNondurablegoodsMiningContractconstructionTransportationand Trade 2publicutilitiesFinanceService2Government(Federal,State,andlocal)Seasonally adjusted1957: JanuaryFebruaryMarchAprilMayJuneJulyAugustSeptember..OctoberNovember 4 -December 4 _52, 49352, 57752, 54752, 59352, 69852, 77352, 81552, 84452, 66252, 46952, 23751, 89517,05316, 99516, 96216, 96516, 94616, 92416,88016,83616, 68116,60416, 47416, 28110,0069,9809,9459,9289,9159,9079,8699,8449,7009,6499,5489,3907,0477,0157,0177,0377,0317,0177,0116,9926,9816,9556,9266,8918328338318418438548618538498378258162,9633,0203,0623,0593,0973,1083,0613,0323,0283,0132,9562,9064,1884,1684,1684,1604,1594,1644,1684,1844,1754,1484,1124,07611,46511, 51911,49011,50111, 54211, 57911, 63611, 66911,62011, 59011, 57111, 4712,3162,3242,3222,3202,3292,3362,3432,3542,3612,3682,3682,3656,3666,4016,3816,4006,4246,4546,4926,4776,5086,4826,5156,5457,3107,3177,3317,3477,3587,3547,3747,4397,4407,4277,4167.4351 Includes all full- and part-time wage and salary workers in nonagricultural establishments who workedduring, or received pay for, any part of the pay period ending nearest the 15th of the month. Excludesproprietors, self-employed persons, domestic servants, and unpaid family workers. Not comparable withestimates of nonagricultural employment of the civilian labor force (Table F-17) which include proprietors,self-employed persons, domestic servants, and unpaid family workers, which count persons as employedwhen they are not at work because of industrial disputes, bad weather, etc., and which are based on a samplesurvey of households, whereas the estimates in this table are based on reports from employing establishments.2 Beginning with 1939, data are not strictly comparable with data shown for earlier years because of theshift of the automotive repair service industry from the trade to the service division.3 Not available.4 Preliminary.NOTE.—Detail will not necessarily add to totals because of rounding.Source: Department of Labor.