


Create successful ePaper yourself
Turn your PDF publications into a flip-book with our unique Google optimized e-Paper software.
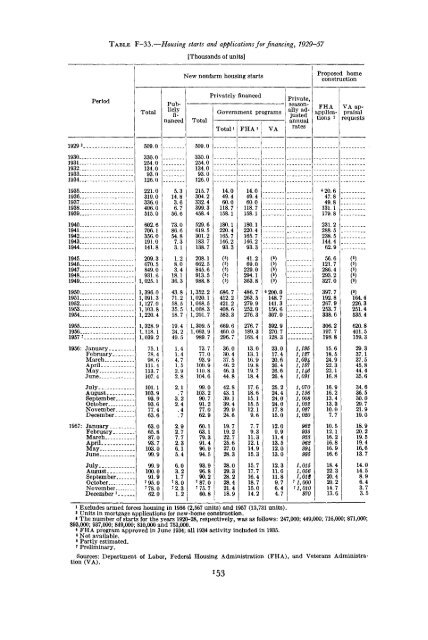
TABLE F-33.—Housing starts and applications for financing, 1929-57[Thousands of units]New nonfarm housing startsProposed homeconstructionPeriodTotalPubliclyfinancedPrivately financedGovernment programsTotalTotal i FHAi VAPrivate,seasonallyadjustedannualratesFHAapplications2VA appraisalrequests1929 3. 509.0 509.0193019311932193319341935..1936..1937..1938..1939..1940..1941..1942..1943..1944..1945..-1946.—1947..-1948.—1949.—1950..1951..1952..1953..1954..1955..1956..1957 71956: JanuaryFebruaryMarchAprilMayJuneJulyAugustSeptember..OctoberNovember..December..1957: January __February.MarchAprilMayJuneJulyAugustSeptember. _OctoberNovember..December 7 _330.0254.0134.093.0126.0221.0319.0336.0406.0515.0602.6706.1356. 0191.0141.8209.3670.5849.0931.61, 025.11, 396.01, 091. 31,127. 01,103. 81,220. 41, 328.91,118.11,039.275.178.498.6111.4113.7107. 4101.1103.993.993.677.463.663.065.887.093.7103.099.9100.091.97 95.07 78.062.05.314.83.66.756.673.086.654.87.33.11.28.03.418.136.343.871.258.535.518.719.424.249.51.41.44.71.52.92.82.1.73.22.4.4.72.92.77.72.36.15.46.03.21.77 8.07 2.31.2330.0254.0134.093.0126.0215.7304.2332.4399.3458.4529. 6619.5301.2183.7138.7208.1662.5845.6913. 51, 352. 21, 020.11,068. 51,068. 31, 201. 71,309. 51, 093. 9989.773.777.093.9109.9110.8104.699.0103.290.791.277.062.960.163.179.391.496.994.593.996.890.27 87.07 75.760.814.049.460.0118.7158.1180.1220.4165.7146.293.3686.7412.2421.2408.6583.3669.6460. 0296.736.030.437.546.246.344.842.843.139.139.429.924.619.719.222.725.627.028.328.029.328.228.421.418.914.049.460.0118.7158.1180.1220.4165.7146.293.341.269.0229.0294.1363.8486.7263.5279.9252.0276.3276.7189.3168.413.013.116.919.819.718.417.618.615.115.512.19.67.79.311.312.114.915.315.717.716.418.715.014.2()0)()6 200. 0148.7141.3156.6307.0392.9270.7128.323.017.420.626.426.626.425.224.424.024.017.815.012.09.911.413.512.013.012.311.611.89.76.44.71,1951,1271,09 k1,1571,1461,0911,0701,1361,0081,0521,0271,0209359339629949951,0151,0561,0127 1,00011,010970* 20. 647.849.8131.1179.8231.2288.5238.5144.462.956.6121.7286.4293.2327.0397.7192.8267.9253.7338.6306.2197.7198.815.618.524.922.322.116.816.916.213. 413.310.07.710. 512.116.216.816.916.618.422.320.420.214.713.6()164.4226.3251.4535.4620.8401.5159.31 Excludes armed forces housing in 1956 (2,567 units) and 1957 (13,731 units).2 Units in mortgage applications for new-home construction.» The number of starts for the years 1920-28, respectively, was as follows: 247,000; 449,000; 716,000; 871,000;893,000; 937,000; 849,000; 810,000 and 753,000.* FHA program approved in June 1934; all 1934 activity included in 1935.8 Not available.6 Partly estimated.7 Preliminary.Sources: Department of Labor, Federal Housing Administration (FHA), and Veterans Administration(VA).15329.337.137.545.844.435.634.636.530.029.721.919.018.920.219.519.416.613.714.014.58.96.43.73.5


