


You also want an ePaper? Increase the reach of your titles
YUMPU automatically turns print PDFs into web optimized ePapers that Google loves.
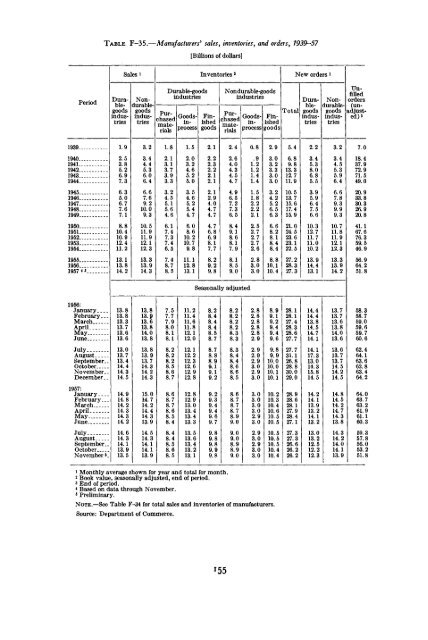
TABLE F-35.—Manufacturers* sales, inventories, and orders, 1939—57[Billions of dollars]PeriodDurablegoodsindustriesNondurablegoodsindustriesPurchasedmate- jrialsInventories 2Durable-goodsindustriesGoodsinprocessFinishedgoodsNondurable-goodsindustriesPurchasedmaterialsGoodsinprocessFinishedgoodsTotalNew orders *DurablegoodsindustriesNondurablegoodsindustriesUnfilledorders(unadjusted)31940—1941....1942....1943—.1944....1945...1946...1947—1948—1949—1950—1951—1952...1953...1954...1955...1956...1957 * *.1956:JanuaryFebruary...MarchAprilMayJuneJulyAugustSeptember..OctoberNovember.December..1957:JanuaryFebruary..MarchAprilMayJuneJulyAugustSeptember.OctoberNovember 5 1.92.53.85.26.97.36.35.06.77.67.18.810.410.912.411.213.113.814.23.23.44.45.36.06.46.67.69.210.09.310.511.911.912.112.313.313.914.31.82.13.13.73.93.33.24.55.15.64.66.17.47.37.46.57.48.78.51.52.03.24.65.25.03.54.65.25.44.76.08.610.210.79.811.112.813.12.12.22.32.22.12.12.12.94.04.74.74.76.86.98.17.78.29.22.42.64.04.34.54.74.96.57.27.36.58.49.18.68.17.98.18.59.00.81.21.21.41.41.51.82.22.22.12.52.72.72.72.62.83.03.02.93.03.23.33.03.03.24.25.26.56.36.68.28.18.48.48.810.110.45.46.89.813.312.711.910.513.715.617.415.921.024.523.623.122.527.228.327.32.23.45.38.06.85.53.95.96.47.56.610.312.711.711.010.213.914.413.1Seasonally adjusted13.813.813.313.713.613.613.013.713.414.414.314.514.914.814.214.314.314.214.614.314.113.913.513.813.913.613.814.013.813.813.913.714.314.214.315.014.714.214.414.313.914.514.314.114.113.97.57.77.98.08.18.18.28.28.28.58.68.78.68.78.78.68.58.48.48.48.58.68.511.211.411.611.812.112.012.112.212.312.612.912.812.812.913.013.413.413.313.513.613.413.213.18.28.48.48.48.58.78.78.88.99.19.19.29.29.39.49.49.69.79.89.89.89.99.88.28.28.28.28.38.38.38.48.48.68.68.58.68.78.78.78.99.09.09.08.98.99.02.82.82.82.82.82.92.92.92.93.02.93.03.03.03.03.02.93.02.93.02.93.03.08.99.19.29.49.49.69.89.910.010.010.110.110.210.310.410.610.510.510.510.510.510.410.428.128.127.428.328.627.727.731.126.828.830.029.028.928.628.127.928.427.127.327.326.626.226.214.414.413.814.514.714.114.117.313.014.315.814.514.214.113.913.214.113.213.013.212.512.212.33.23.44.55.35.96.46.67.89.39.99.310.711.811.912.112.313.313.914.213.713.713.613.814.013.613.613.713.714.514.214.514.814.514.214.714.313.814.314.214.014.113.97.018.437.972.971.549.020.933.830.326.920.841.167.676.359.546.956.964.251.858.358.759.059.659.760.662.464.163.662.863.464.264.063.763.261.961.160.359.357.856.053.251.81 Monthly average shown for year and total for month.2 Book value, seasonally adjusted, end of period.3 End of period.* Based on data through November.5 Preliminary.NOTE.—See Table F-34 for total sales and inventories of manufacturers.Source: Department of Commerce.155


