

Armenia
KudRvx
KudRvx

You also want an ePaper? Increase the reach of your titles
YUMPU automatically turns print PDFs into web optimized ePapers that Google loves.
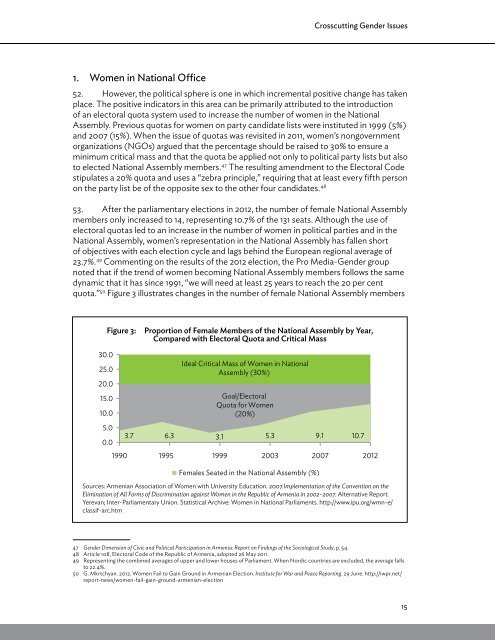
Crosscutting Gender Issues1. Women in National Office52. However, the political sphere is one in which incremental positive change has takenplace. The positive indicators in this area can be primarily attributed to the introductionof an electoral quota system used to increase the number of women in the NationalAssembly. Previous quotas for women on party candidate lists were instituted in 1999 (5%)and 2007 (15%). When the issue of quotas was revisited in 2011, women’s nongovernmentorganizations (NGOs) argued that the percentage should be raised to 30% to ensure aminimum critical mass and that the quota be applied not only to political party lists but alsoto elected National Assembly members. 47 The resulting amendment to the Electoral Codestipulates a 20% quota and uses a “zebra principle,” requiring that at least every fifth personon the party list be of the opposite sex to the other four candidates. 4853. After the parliamentary elections in 2012, the number of female National Assemblymembers only increased to 14, representing 10.7% of the 131 seats. Although the use ofelectoral quotas led to an increase in the number of women in political parties and in theNational Assembly, women’s representation in the National Assembly has fallen shortof objectives with each election cycle and lags behind the European regional average of23.7%. 49 Commenting on the results of the 2012 election, the Pro Media-Gender groupnoted that if the trend of women becoming National Assembly members follows the samedynamic that it has since 1991, “we will need at least 25 years to reach the 20 per centquota.” 50 Figure 3 illustrates changes in the number of female National Assembly membersFigure 3:Proportion of Female Members of the National Assembly by Year,Compared with Electoral Quota and Critical Mass30.025.020.015.010.05.00.0Ideal Critical Mass of Women in NationalAssembly (30%)Goal/ElectoralQuota for Women(20%)3.7 6.3 3.1 5.3 9.1 10.71990 1995 1999 2003 2007 2012Females Seated in the National Assembly (%)Sources: <strong>Armenia</strong>n Association of Women with University Education. 2007.Implementation of the Convention on theElimination of All Forms of Discrimination against Women in the Republic of <strong>Armenia</strong> in 2002–2007. Alternative Report.Yerevan; Inter-Parliamentary Union. Statistical Archive: Women in National Parliaments. http://www.ipu.org/wmn-e/classif-arc.htm47 Gender Dimension of Civic and Political Participation in <strong>Armenia</strong>: Report on Findings of the Sociological Study, p. 54.48 Article 108, Electoral Code of the Republic of <strong>Armenia</strong>, adopted 26 May 2011.49 Representing the combined averages of upper and lower houses of Parliament. When Nordic countries are excluded, the average fallsto 22.4%.50 G. Mkrtchyan. 2012. Women Fail to Gain Ground in <strong>Armenia</strong>n Election. Institute for War and Peace Reporting. 29 June. http://iwpr.net/report-news/women-fail-gain-ground-armenian-election15
