Metodologías para la Resolución de Problemas
Ing. Carlos Bertrand. Presentación en PowerPoint. - PASCA
Ing. Carlos Bertrand. Presentación en PowerPoint. - PASCA
- No tags were found...

Create successful ePaper yourself
Turn your PDF publications into a flip-book with our unique Google optimized e-Paper software.
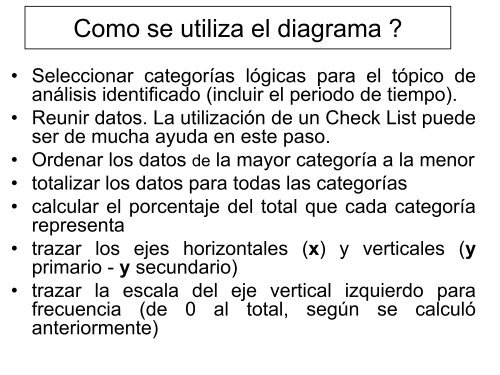
Como se utiliza el diagrama ?<br />
• Seleccionar categorías lógicas <strong>para</strong> el tópico <strong>de</strong><br />
análisis i<strong>de</strong>ntificado (incluir el periodo <strong>de</strong> tiempo).<br />
• Reunir datos. La utilización <strong>de</strong> un Check List pue<strong>de</strong><br />
ser <strong>de</strong> mucha ayuda en este paso.<br />
• Or<strong>de</strong>nar los datos <strong>de</strong> <strong>la</strong> mayor categoría a <strong>la</strong> menor<br />
• totalizar los datos <strong>para</strong> todas <strong>la</strong>s categorías<br />
• calcu<strong>la</strong>r el porcentaje <strong>de</strong>l total que cada categoría<br />
representa<br />
• trazar los ejes horizontales (x) y verticales (y<br />
primario - y secundario)<br />
• trazar <strong>la</strong> esca<strong>la</strong> <strong>de</strong>l eje vertical izquierdo <strong>para</strong><br />
frecuencia (<strong>de</strong> 0 al total, según se calculó<br />
anteriormente)