

TEACHER DIVERSITY
The State of Teacher Diversity_0
The State of Teacher Diversity_0
- No tags were found...

Create successful ePaper yourself
Turn your PDF publications into a flip-book with our unique Google optimized e-Paper software.
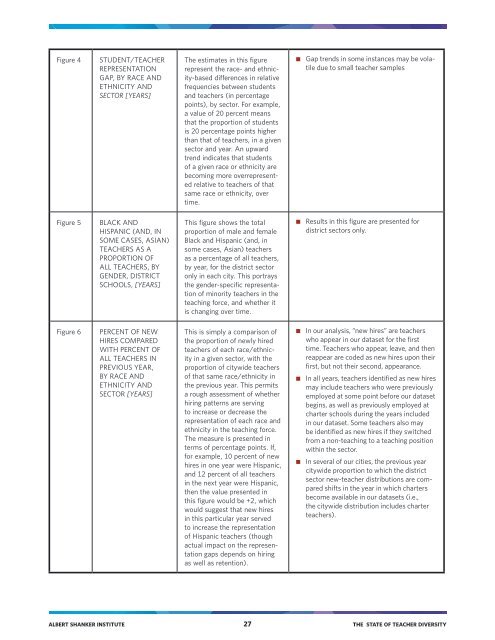
Figure 4<br />
STUDENT/<strong>TEACHER</strong><br />
REPRESENTATION<br />
GAP, BY RACE AND<br />
ETHNICITY AND<br />
SECTOR [YEARS]<br />
The estimates in this figure<br />
represent the race- and ethnicity-based<br />
differences in relative<br />
frequencies between students<br />
and teachers (in percentage<br />
points), by sector. For example,<br />
a value of 20 percent means<br />
that the proportion of students<br />
is 20 percentage points higher<br />
than that of teachers, in a given<br />
sector and year. An upward<br />
trend indicates that students<br />
of a given race or ethnicity are<br />
becoming more overrepresented<br />
relative to teachers of that<br />
same race or ethnicity, over<br />
time.<br />
■■<br />
Gap trends in some instances may be volatile<br />
due to small teacher samples<br />
Figure 5<br />
BLACK AND<br />
HISPANIC (AND, IN<br />
SOME CASES, ASIAN)<br />
<strong>TEACHER</strong>S AS A<br />
PROPORTION OF<br />
ALL <strong>TEACHER</strong>S, BY<br />
GENDER, DISTRICT<br />
SCHOOLS, [YEARS]<br />
This figure shows the total<br />
proportion of male and female<br />
Black and Hispanic (and, in<br />
some cases, Asian) teachers<br />
as a percentage of all teachers,<br />
by year, for the district sector<br />
only in each city. This portrays<br />
the gender-specific representation<br />
of minority teachers in the<br />
teaching force, and whether it<br />
is changing over time.<br />
■■<br />
Results in this figure are presented for<br />
district sectors only.<br />
Figure 6<br />
PERCENT OF NEW<br />
HIRES COMPARED<br />
WITH PERCENT OF<br />
ALL <strong>TEACHER</strong>S IN<br />
PREVIOUS YEAR,<br />
BY RACE AND<br />
ETHNICITY AND<br />
SECTOR [YEARS]<br />
This is simply a comparison of<br />
the proportion of newly hired<br />
teachers of each race/ethnicity<br />
in a given sector, with the<br />
proportion of citywide teachers<br />
of that same race/ethnicity in<br />
the previous year. This permits<br />
a rough assessment of whether<br />
hiring patterns are serving<br />
to increase or decrease the<br />
representation of each race and<br />
ethnicity in the teaching force.<br />
The measure is presented in<br />
terms of percentage points. If,<br />
for example, 10 percent of new<br />
hires in one year were Hispanic,<br />
and 12 percent of all teachers<br />
in the next year were Hispanic,<br />
then the value presented in<br />
this figure would be +2, which<br />
would suggest that new hires<br />
in this particular year served<br />
to increase the representation<br />
of Hispanic teachers (though<br />
actual impact on the representation<br />
gaps depends on hiring<br />
as well as retention).<br />
■■<br />
■■<br />
■■<br />
In our analysis, “new hires” are teachers<br />
who appear in our dataset for the first<br />
time. Teachers who appear, leave, and then<br />
reappear are coded as new hires upon their<br />
first, but not their second, appearance.<br />
In all years, teachers identified as new hires<br />
may include teachers who were previously<br />
employed at some point before our dataset<br />
begins, as well as previously employed at<br />
charter schools during the years included<br />
in our dataset. Some teachers also may<br />
be identified as new hires if they switched<br />
from a non-teaching to a teaching position<br />
within the sector.<br />
In several of our cities, the previous year<br />
citywide proportion to which the district<br />
sector new-teacher distributions are compared<br />
shifts in the year in which charters<br />
become available in our datasets (i.e.,<br />
the citywide distribution includes charter<br />
teachers).<br />
ALBERT SHANKER INSTITUTE 27 THE STATE OF <strong>TEACHER</strong> <strong>DIVERSITY</strong>