

TEACHER DIVERSITY
The State of Teacher Diversity_0
The State of Teacher Diversity_0
- No tags were found...

You also want an ePaper? Increase the reach of your titles
YUMPU automatically turns print PDFs into web optimized ePapers that Google loves.
As in all of the cities we examined, White teachers are heavily overrepresented (more than 5 to 1) relative to<br />
White students. As for the under-representation of teachers, the greatest student-teacher gaps were among<br />
Asians (14 percentage points) and Hispanics (12 percentage points), with a modest gap among Blacks (about 4<br />
percentage points).<br />
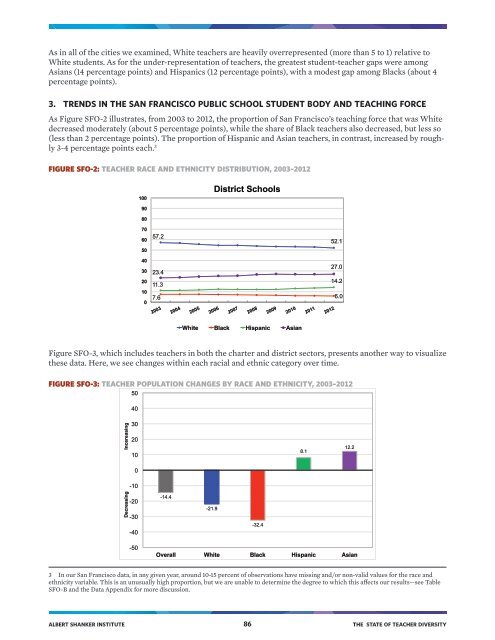
3. TRENDS IN THE SAN FRANCISCO PUBLIC SCHOOL STUDENT BODY AND TEACHING FORCE<br />
As Figure SFO-2 illustrates, from 2003 to 2012, the proportion of San Francisco’s teaching force that was White<br />
decreased moderately (about 5 percentage points), while the share of Black teachers also decreased, but less so<br />
(less than 2 percentage points). The proportion of Hispanic and Asian teachers, in contrast, increased by roughly<br />
3-4 percentage points each. 3<br />
FIGURE SFO-2: <strong>TEACHER</strong> RACE AND ETHNICITY DISTRIBUTION, 2003–2012<br />
100<br />
District Schools<br />
90<br />
80<br />
70<br />
60<br />
50<br />
57.2<br />
52.1<br />
40<br />
30<br />
20<br />
10<br />
0<br />
27.0<br />
23.4<br />
14.2<br />
11.3<br />
7.6 6.0<br />
White Black Hispanic Asian<br />
Figure SFO-3, which includes teachers in both the charter and district sectors, presents another way to visualize<br />
these data. Here, we see changes within each racial and ethnic category over time.<br />
FIGURE SFO-3: <strong>TEACHER</strong> POPULATION CHANGES BY RACE AND ETHNICITY, 2003–2012<br />
50<br />
40<br />
Decreasing Incereasing<br />
30<br />
20<br />
10<br />
0<br />
-10<br />
-20<br />
-30<br />
-14.4<br />
-21.9<br />
8.1<br />
12.2<br />
-32.4<br />
-40<br />
-50<br />
Overall White Black Hispanic Asian<br />
3 In our San Francisco data, in any given year, around 10-15 percent of observations have missing and/or non-valid values for the race and<br />
ethnicity variable. This is an unusually high proportion, but we are unable to determine the degree to which this affects our results—see Table<br />
SFO-B and the Data Appendix for more discussion.<br />
ALBERT SHANKER INSTITUTE 86 THE STATE OF <strong>TEACHER</strong> <strong>DIVERSITY</strong>