

TEACHER DIVERSITY
The State of Teacher Diversity_0
The State of Teacher Diversity_0
- No tags were found...

Create successful ePaper yourself
Turn your PDF publications into a flip-book with our unique Google optimized e-Paper software.
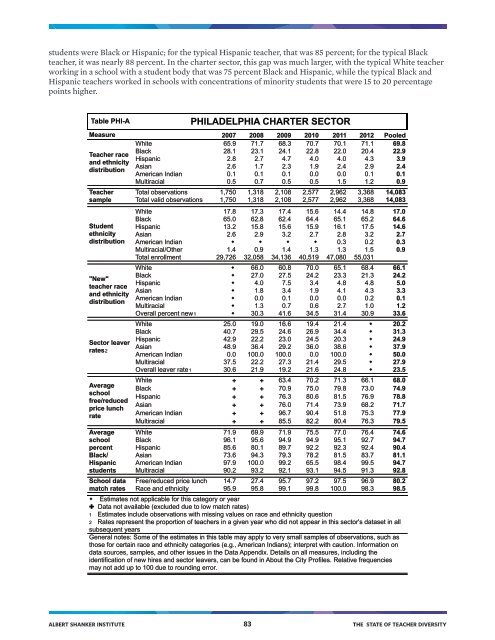
students were Black or Hispanic; for the typical Hispanic teacher, that was 85 percent; for the typical Black<br />
teacher, it was nearly 88 percent. In the charter sector, this gap was much larger, with the typical White teacher<br />
working in a school with a student body that was 75 percent Black and Hispanic, while the typical Black and<br />
Hispanic teachers worked in schools with concentrations of minority students that were 15 to 20 percentage<br />
points higher.<br />
Table PHI-A<br />
Measure 2007 2008 2009 2010 2011 2012 Pooled<br />
White 65.9 71.7 68.3 70.7 70.1 71.1 69.8<br />
Teacher race<br />
and ethnicity<br />
distribution<br />
Teacher<br />
sample<br />
Student<br />
ethnicity<br />
distribution<br />
"New"<br />
teacher race<br />
and ethnicity<br />
distribution<br />
Sector leaver<br />
rates2<br />
Average<br />
school<br />
free/reduced<br />
price lunch<br />
rate<br />
Average<br />
school<br />
percent<br />
Black/<br />
Hispanic<br />
students<br />
School data<br />
match rates<br />
PHILADELPHIA CHARTER SECTOR<br />
Black 28.1 23.1 24.1 22.8 22.0 20.4 22.9<br />
Hispanic 2.8 2.7 4.7 4.0 4.0 4.3 3.9<br />
Asian 2.6 1.7 2.3 1.9 2.4 2.9 2.4<br />
American Indian 0.1 0.1 0.1 0.0 0.0 0.1 0.1<br />
Multiracial 0.5 0.7 0.5 0.5 1.5 1.2 0.9<br />
Total observations 1,750 1,318 2,108 2,577 2,962 3,368 14,083<br />
Total valid observations 1,750 1,318 2,108 2,577 2,962 3,368 14,083<br />
White 17.8 17.3 17.4 15.6 14.4 14.8 17.0<br />
Black 65.0 62.8 62.4 64.4 65.1 65.2 64.6<br />
Hispanic 13.2 15.8 15.6 15.9 16.1 17.5 14.6<br />
Asian 2.6 2.9 3.2 2.7 2.8 3.2 2.7<br />
American Indian ! ! ! ! 0.3 0.2 0.3<br />
Multiracial/Other 1.4 0.9 1.4 1.3 1.3 1.5 0.9<br />
Total enrollment 29,726 32,058 34,136 40,519 47,080 55,031<br />
White ! 66.0 60.8 70.0 65.1 68.4 66.1<br />
Black ! 27.0 27.5 24.2 23.3 21.3 24.2<br />
Hispanic ! 4.0 7.5 3.4 4.8 4.8 5.0<br />
Asian ! 1.8 3.4 1.9 4.1 4.3 3.3<br />
American Indian ! 0.0 0.1 0.0 0.0 0.2 0.1<br />
Multiracial ! 1.3 0.7 0.6 2.7 1.0 1.2<br />
Overall percent new1 ! 30.3 41.6 34.5 31.4 30.9 33.6<br />
White 25.0 19.0 16.6 19.4 21.4 ! 20.2<br />
Black 40.7 29.5 24.6 26.9 34.4 ! 31.3<br />
Hispanic 42.9 22.2 23.0 24.5 20.3 ! 24.9<br />
Asian 48.9 36.4 29.2 36.0 38.6 ! 37.9<br />
American Indian 0.0 100.0 100.0 0.0 100.0 ! 50.0<br />
Multiracial 37.5 22.2 27.3 21.4 29.5 ! 27.9<br />
Overall leaver rate1 30.6 21.9 19.2 21.6 24.8 ! 23.5<br />
White ✚ ✚ 63.4 70.2 71.3 66.1 68.0<br />
Black ✚ ✚ 70.9 75.0 79.8 73.0 74.9<br />
Hispanic ✚ ✚ 76.3 80.6 81.5 76.9 78.8<br />
Asian ✚ ✚ 76.0 71.4 73.9 68.2 71.7<br />
American Indian ✚ ✚ 96.7 90.4 51.8 75.3 77.9<br />
Multiracial ✚ ✚ 85.5 82.2 80.4 76.3 79.5<br />
White 71.9 69.9 71.9 75.5 77.0 76.4 74.6<br />
Black 96.1 95.6 94.9 94.9 95.1 92.7 94.7<br />
Hispanic 85.6 80.1 89.7 92.2 92.3 92.4 90.4<br />
Asian 73.6 94.3 79.3 78.2 81.5 83.7 81.1<br />
American Indian 97.9 100.0 99.2 65.5 98.4 99.5 94.7<br />
Multiracial 90.2 93.2 92.1 93.1 94.5 91.3 92.8<br />
Free/reduced price lunch 14.7 27.4 95.7 97.2 97.5 96.9 80.2<br />
Race and ethnicity 95.9 95.8 99.1 99.8 100.0 98.3 98.5<br />
! Estimates not applicable for this category or year<br />
✚ Data not available (excluded due to low match rates)<br />
1 Estimates include observations with missing values on race and ethnicity question<br />
2 Rates represent the proportion of teachers in a given year who did not appear in this sector's dataset in all<br />
subsequent years<br />
General notes: Some of the estimates in this table may apply to very small samples of observations, such as<br />
those for certain race and ethnicity categories (e.g., American Indians); interpret with caution. Information on<br />
data sources, samples, and other issues in the Data Appendix. Details on all measures, including the<br />
identification of new hires and sector leavers, can be found in About the City Profiles. Relative frequencies<br />
may not add up to 100 due to rounding error.<br />
ALBERT SHANKER INSTITUTE 83 THE STATE OF <strong>TEACHER</strong> <strong>DIVERSITY</strong>